ALGO Price Analysis: Can the Rally Target $1?
The post ALGO Price Analysis: Can the Rally Target $1? appeared first on Coinpedia Fintech News
Algorand is back on the list of top performers with a broader market recovery as Bitcoin crosses above $96k. With a price surge of 20% this week, Algorand is ready for a cross above $0.50.
Will Algorand price continue the bullish recovery? Let’s find out in our latest ALGO price analysis.
ALGO Price AnalysisIn the weekly chart, the Algorand price action showcases a bullish breakout of a long-coming resistance trend line. The Algo price trend showcases the fourth consecutive bullish candle in formation.
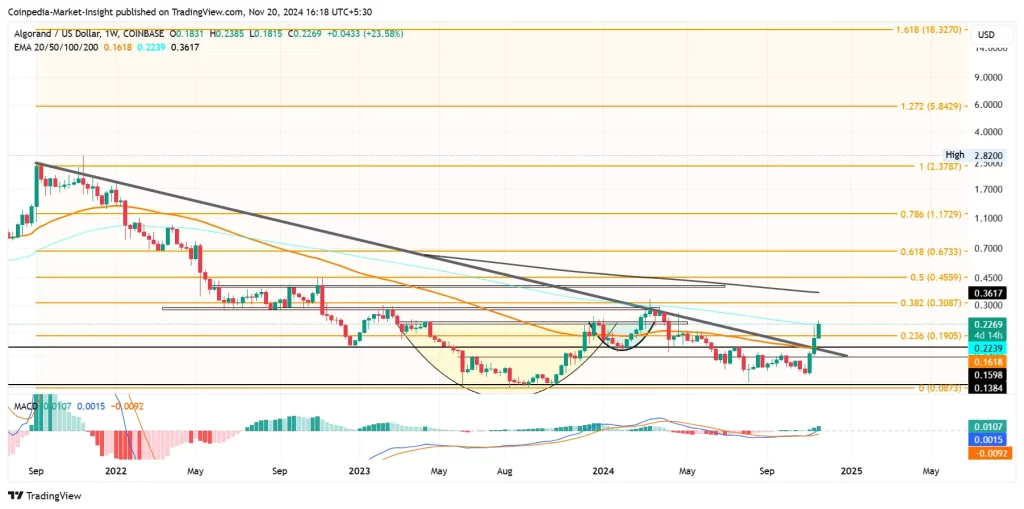
Furthermore, the recovery rally accounts for a price surge of more than 200%, starting from $0.091 to the current market price of $0.3426. The recovery rally has surpassed the 38.20% Fibonacci low at $0.3087, along with the 50-week and 100-week EMA line.
Currently, the higher price action in the intraday candle is challenging the 200-week EMA line, preparing for a bullish rally. Along with the dynamic resistance, the price action showcases a resistance zone present between $0.39 and $0.40. Hence, for an uptrend continuation, the Algo price must surpass the $0.40 mark.
Technical indicators:
EMA: Supporting the bullish recovery, the 50-week and 100-week EMA lines witness an uptick, increasing the chances of a bullish crossover.
MACD: The MACD and signal lines have skyrocketed with the massive surge of positive histograms. Hence, the technical indicators maintain a buy signal for Algorand.
Will ALGO Price Recover $0.50?Based on the Fibonacci retracement tool, the Algo price action is inching closer to the 50% Fibonacci level at $0.4559. Hence, the immediate price action showcases a minimum upside potential of nearly 12%.
A bullish breakout will increase the chances of an uptrend reaching the $1 psychological mark. On the flip side, the crucial support remains at $0.3087.
Will this recovery run in Algorand reach $10 in 2025? Find out now in Coinpedia’s ALGO price prediction.
FAQS What triggered Algorand’s 200% recovery rally?A bullish breakout of a long-standing resistance trend line and positive momentum across technical indicators.
What are Algorand’s key price levels?Immediate support at $0.3087, resistance at $0.40, and upside targets at $0.4559 and $1.
Are technical indicators suggesting more upside for Algorand?Yes, MACD, EMA alignment, and Fibonacci retracement indicate a bullish continuation.