ATOM Price Rally Breaks $6: Fibonacci Levels Hint at $10 Target

The post ATOM Price Rally Breaks $6: Fibonacci Levels Hint at $10 Target appeared first on Coinpedia Fintech News
As altcoins are ready to shoot up in this bull market, ATOM price makes a Phoenix-style recovery. Overcoming long-term bearish influence, the $6 breakout run aims to change the trend character with a 50% Fibonacci breakout.
Will the bullish trend find broader market support to extend the rally to the $10 psychological in 2024? Let’s find out in our latest ATOM price prediction.
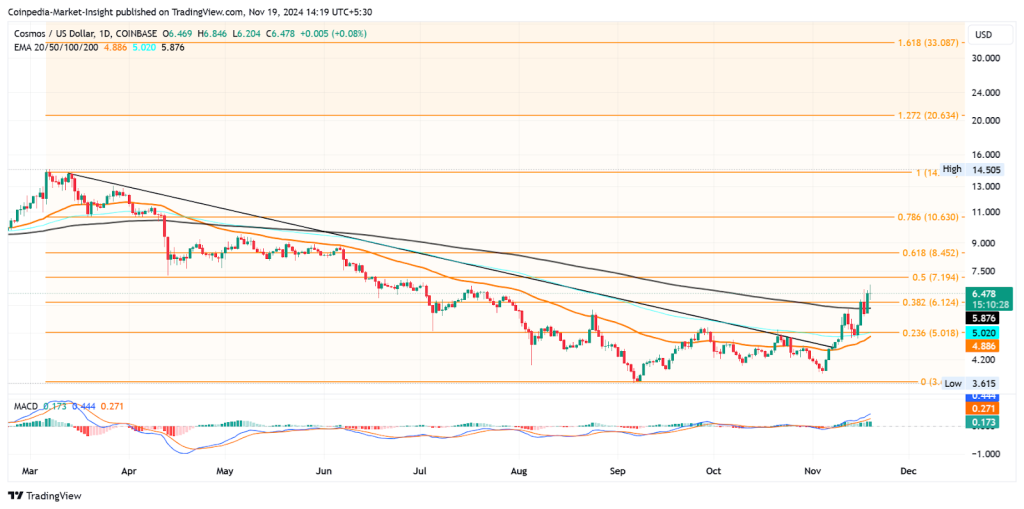
Cosmos (ATOM) Price Crosses $6In the daily chart, the ATOM price action shows a V-shaped reversal gaining momentum. Starting from the $3.90 mark, the bullish recovery overcomes the resistance trendline impact with the breakout rally.

The breakout rally now stands at a 65% rise and is currently trading at $6.46. Following the massive 13.98% jump last night, creating a bullish and golden candle, the ATOM price action has broken multiple crucial resistance levels.
The altcoin has surpassed the 200-day exponential moving average line and the 38.20% Fibonacci level priced at $6.124. As the trend reversal gains momentum, the Fibonacci level breakout mark increases the credibility of the trend reversal rally.
Technical indicators:EMA: The surge of bullish influence over the ATOM price trend teases a positive crossover between the 50-day and 100-day EMA lines. Furthermore, the 200-day EMA witnesses an uptick.
MACD: Aligning with the average lines, the MACD and signal lines maintain a positive trend.
Will The ATOM Price Top $10?Based on the increasing trend momentum and the broader market recovery, the Fibonacci tool paint a bullish price target for ATOM. The immediate resistance for Cosmos stands at the 50% Fibonacci level at $7.19.
The bullish breakout of $7.19 will increase the chances of the Cosmos price reaching the $10 psychological mark. Beyond this, the 78.60% Fibonacci mark at $10.63 is the potential target range by the end of 2024.
On the flip side, the crucial supports are at the $6.124 and $5 psychological mark. However, the dynamic average lines at $5.87 and $5.02 could also help absorb any sudden surge in supply.
With a bullish reversal at play, will Cosmos reach $100? Find out more about Coinpedia’s latest ATOM price prediction.
FAQs What is the current price of Cosmos (ATOM)?
Cosmos (ATOM) is currently trading at $6.46, with a 65% rise from its recent low of $3.90 and a 13.98% surge last night.
What are the key resistance levels for ATOM in the ongoing rally?
The immediate resistance is the 50% Fibonacci level at $7.19, with long-term targets at $10 and $10.63 (78.60% Fibonacci level).
What technical indicators support the ATOM price recovery?A potential bullish EMA crossover, an uptick in the 200-day EMA, and positive MACD trends confirm the strength of the current rally.
