Dogecoin (DOGE) Price at Risk of Correction Amid Rising Selling Pressure
Dogecoin (DOGE) price hit its highest level since 2021 on November 23 but has since entered a correction, dropping 12% in the last 24 hours. The Ichimoku Cloud, DMI, and EMA indicators all point to growing bearish momentum, with DOGE trading below critical levels and showing signs of weakening upward pressure.
If the downtrend continues, DOGE could test support at $0.34, with a potential drop to $0.14 if selling pressure intensifies. However, a recovery could see DOGE challenge resistances at $0.43 and $0.48, potentially aiming for $0.50, a key milestone not reached since March 2021.
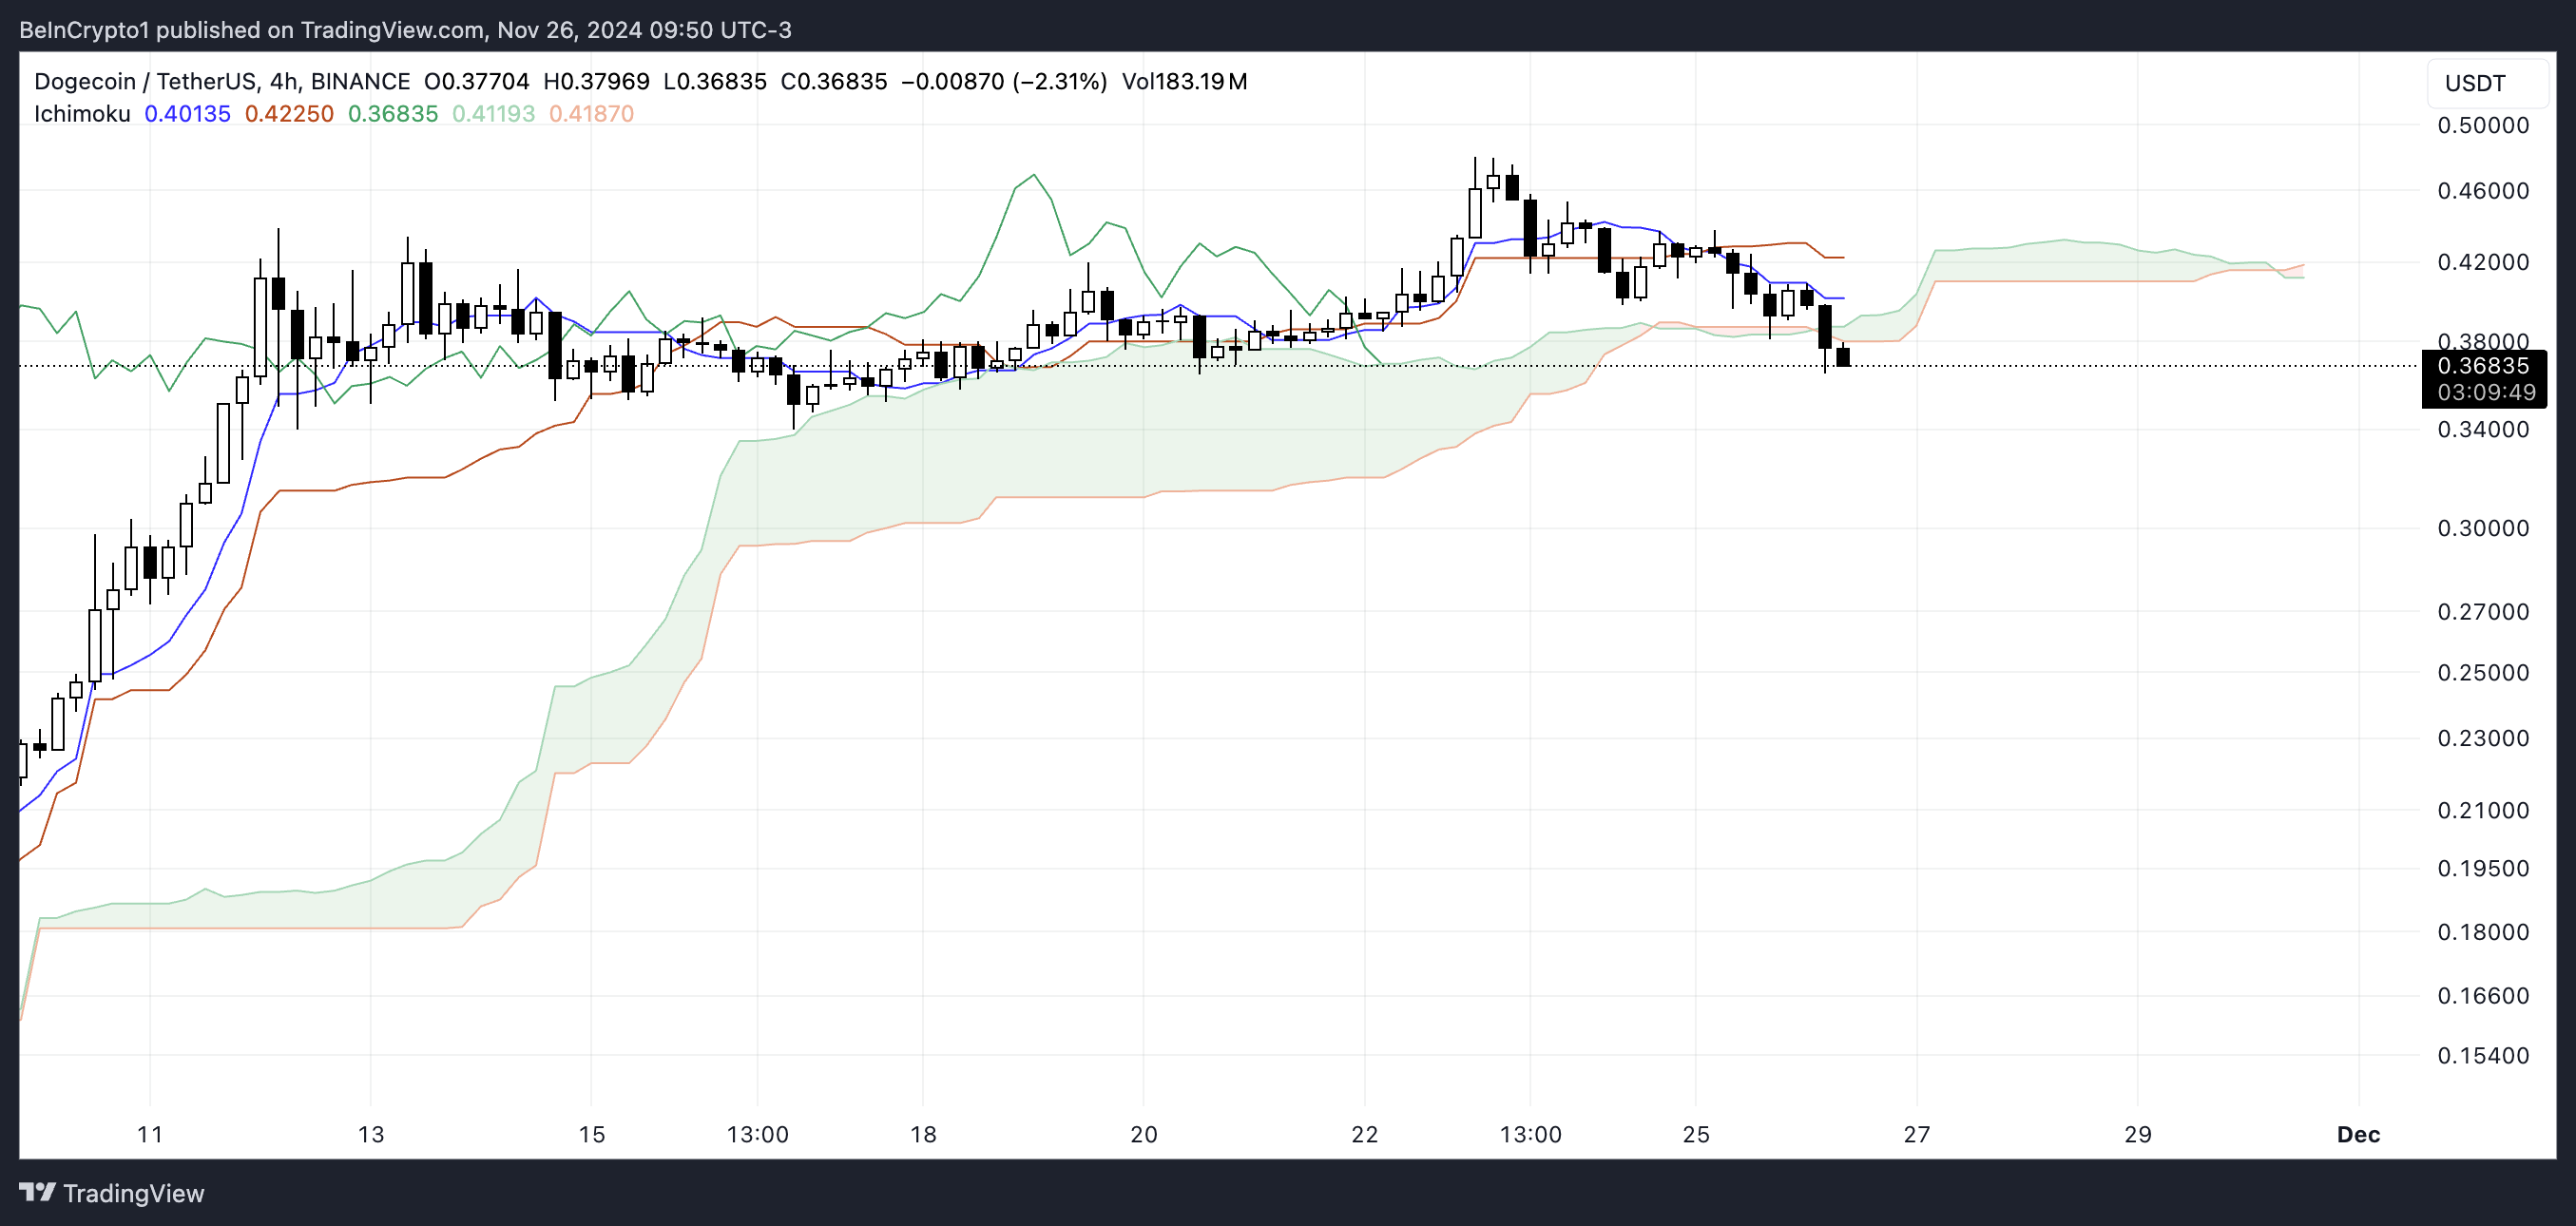
DOGE Ichimoku Cloud Shows The Sentiment Is ChangingThe Ichimoku Cloud chart for DOGE shows a bearish outlook. The price is trading below both the Tenkan-Sen (blue line) and Kijun-Sen (orange line), indicating downward momentum. The price has also dropped below the cloud (Senkou Span A and B), suggesting a bearish trend has solidified.
The cloud itself, now turning thinner toward the right side of the chart, signals weakening support, increasing the likelihood of further downward pressure.
 DOGE Ichimoku Cloud. Source: TradingView
If DOGE fails to reclaim the cloud and hold above the Kijun-Sen, bearish momentum could accelerate, pushing the price lower. However, the flat base of the Kijun-Sen could act as a minor resistance, and a bounce back above the cloud would indicate a potential trend reversal.
For now, the Ichimoku Cloud suggests that Dogecoin price is in a critical phase, during which the bears will remain in control unless a strong recovery occurs.
Dogecoin’s Downtrend Could Get StrongerDogecoin DMI chart indicates an ADX of 22.84, with D+ at 13.5 and D- at 29.7, highlighting a potential shift in momentum. The ADX, or Average Directional Index, measures the strength of a trend, with values above 25 indicating a significant trend, regardless of direction.
Meanwhile, D+ represents bullish strength, and D- represents bearish strength. In this case, the higher D- compared to D+ confirms that bearish forces are currently dominating DOGE’s price action.
 DOGE DMI. Source: TradingView
Although the ADX at 22.84 suggests that the downtrend is not yet strongly established, the widening gap between D- and D+ points to growing bearish momentum.
This setup indicates that DOGE is likely entering a downtrend, with selling pressure outweighing buying interest. If the ADX continues to rise above 25 while D- remains dominant, it could confirm a stronger bearish trend, leading to further price declines.
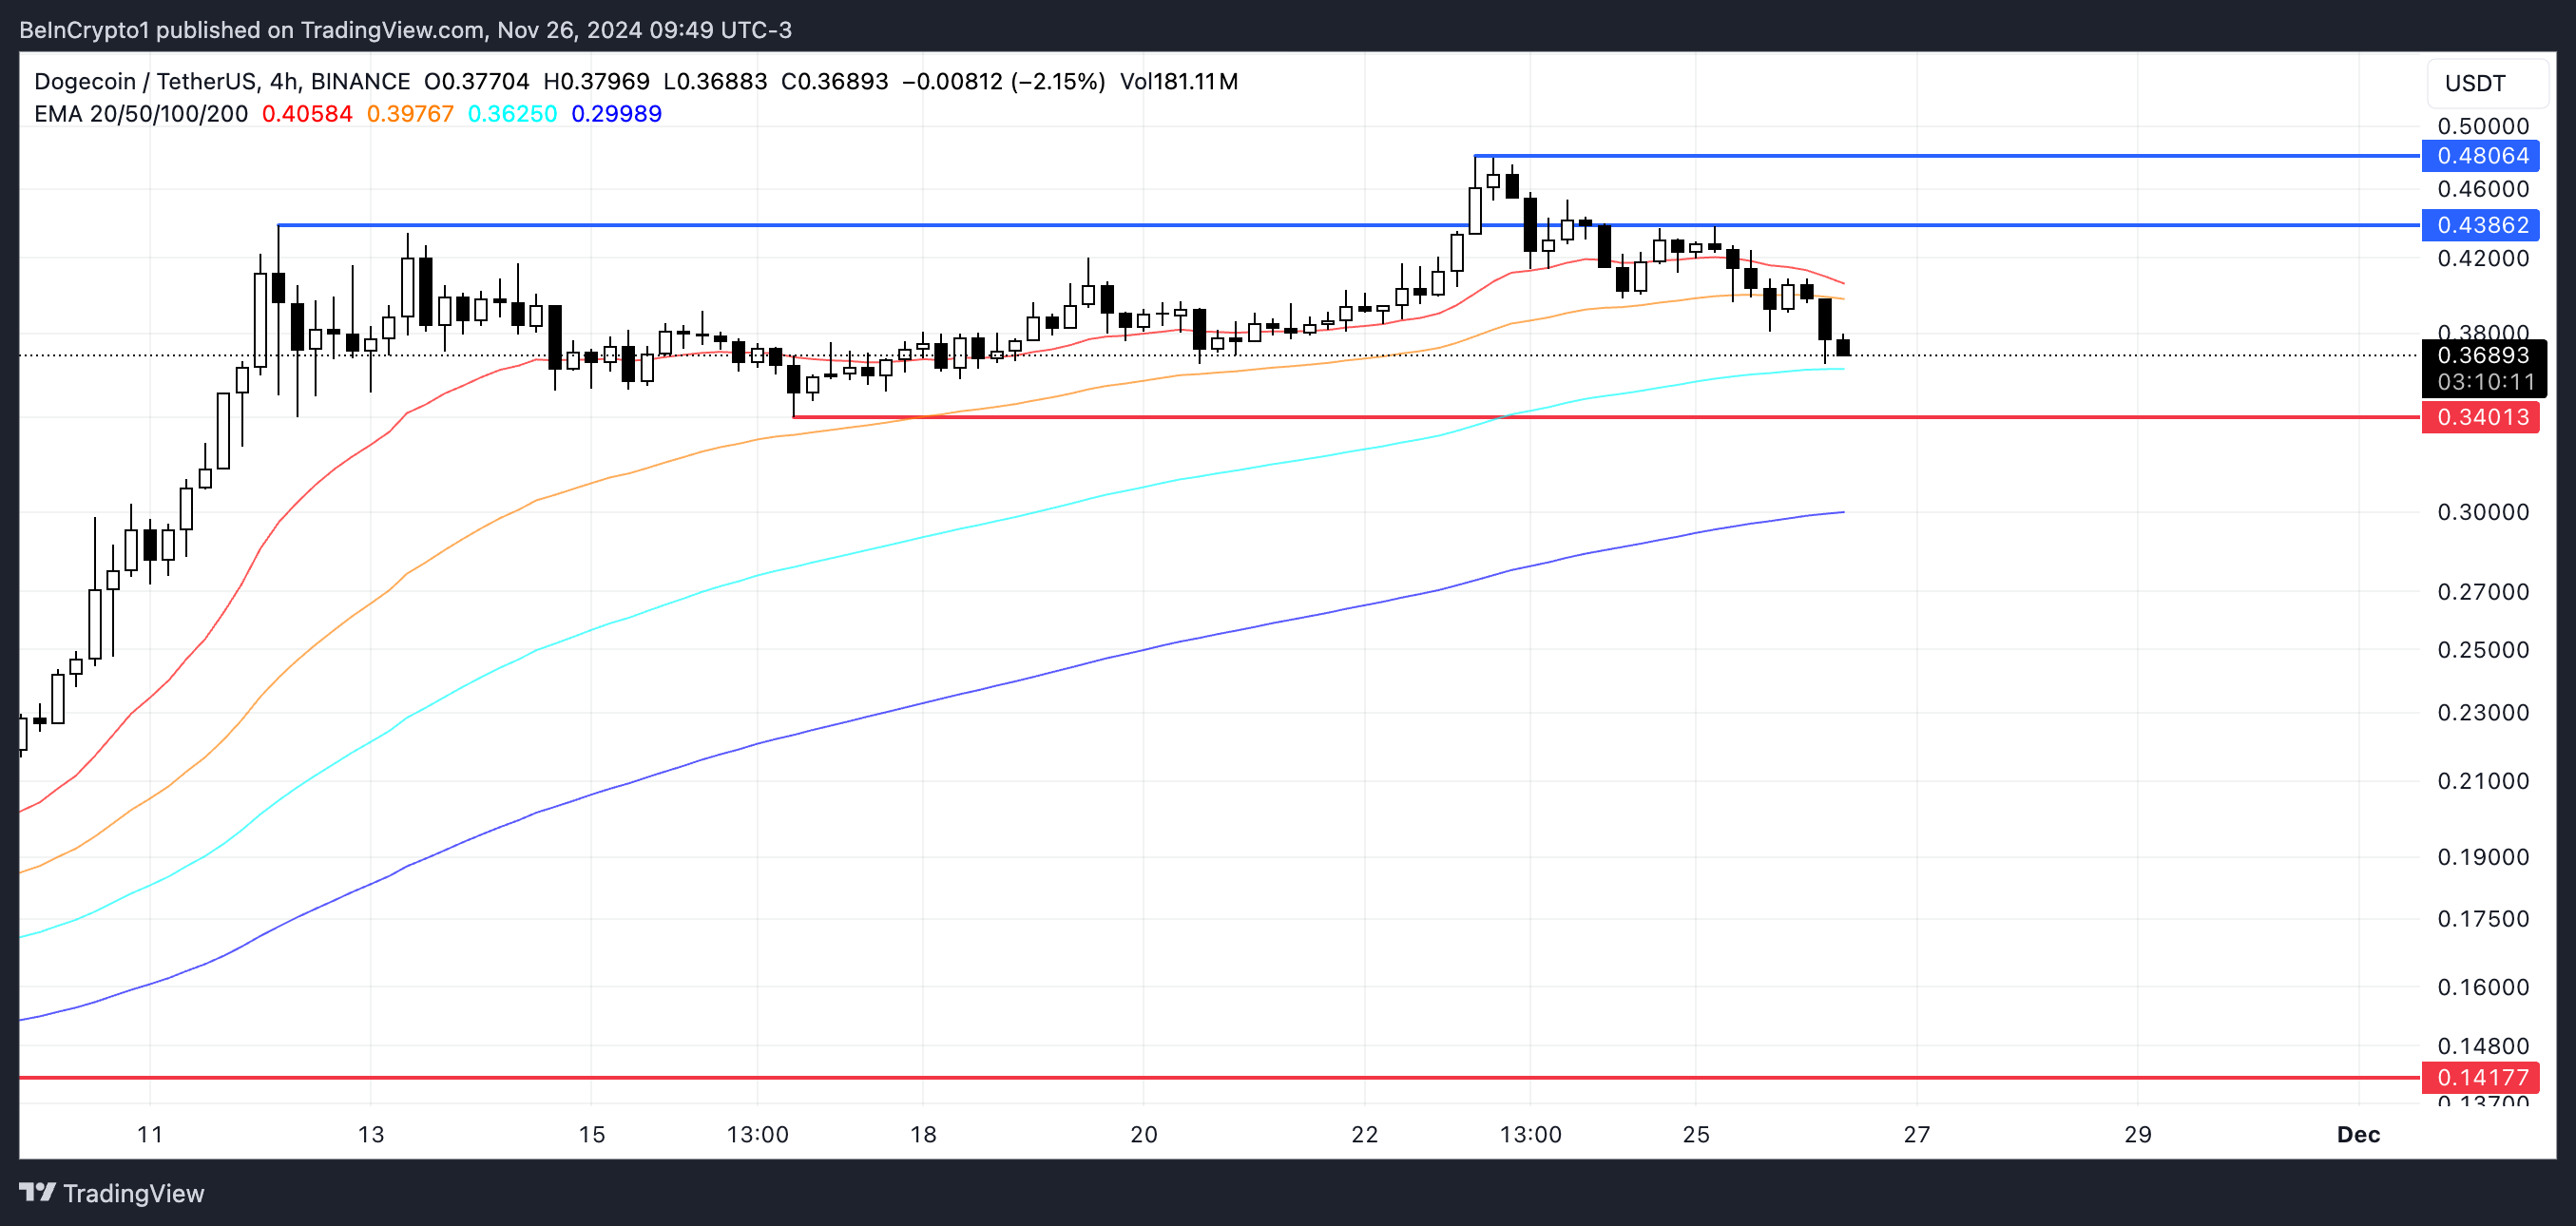
DOGE Price Prediction: Can DOGE Reach $0.50 In November?Dogecoin EMA lines suggest a shift in market sentiment from bullish to bearish, with the current price trading below the short-term EMA lines.
Additionally, these short-term lines are trending downward, indicating growing selling pressure and a weakening upward momentum. This bearish development suggests that DOGE price is losing its previous bullish support, potentially paving the way for further price declines.
 DOGE Price Analysis. Source: TradingView
If the downtrend strengthens, Dogecoin price could test key support at $0.34. If this level fails to hold, the price might drop as low as $0.14, marking a significant 61% correction.
However, if DOGE price manages to reverse the trend and regain bullish momentum, it could challenge resistances at $0.43 and $0.48. Breaking through these levels would likely push DOGE toward $0.50, a price not seen since March 2021, signaling a strong recovery.
The post Dogecoin (DOGE) Price at Risk of Correction Amid Rising Selling Pressure appeared first on BeInCrypto.
