Flare Price Breaks $0.035: Parabolic Rally Targets $0.056

The post Flare Price Breaks $0.035: Parabolic Rally Targets $0.056 appeared first on Coinpedia Fintech News
Amid the rising altcoin rally, Flare is among the top-performing altcoins in the top 100 list. With a price spike of 24% since the previous day, the Flare market price has surpassed the $0.035 milestone.
On the verge of hitting the $2 billion market cap, FLR is preparing to extend its parabolic surge. Following the nearly 186% surge in the past 30 days, FLR prices are preparing for a massive surge in December 2024. So, let’s look closer at the upcoming rally in FLR prices.
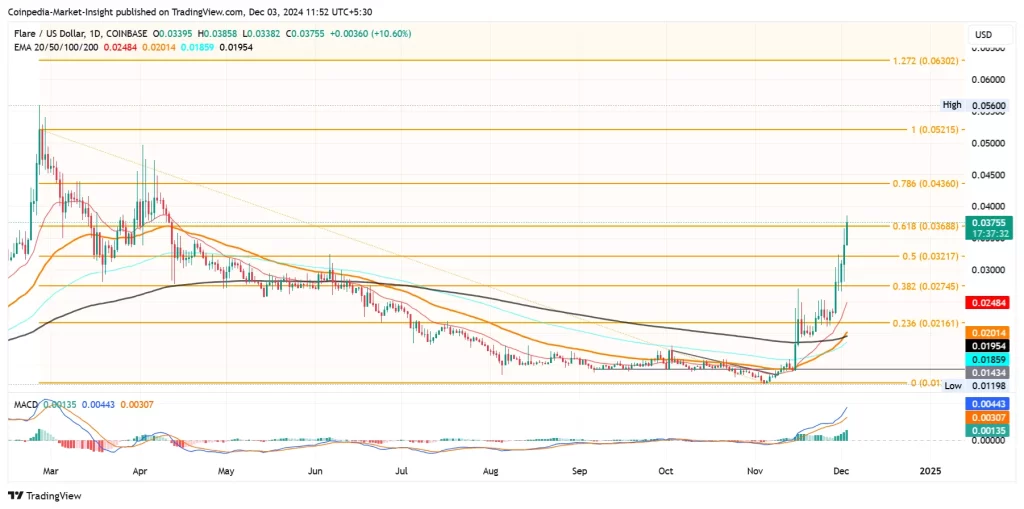
Flare Price AnalysisIn the daily chart, the Flare price action shows a parabolic rally, gaining momentum. With a streak of positive histograms, the FLR price has surpassed the $0.035 critical psychological resistance.

Furthermore, the five-day streak of consecutive bullish candles has accounted for a price surge of nearly 60%. The Flare price recovery rally has surpassed 61.80% from the March level at $0.03688.
Starting from $0.012, the recovery run has now achieved 200% returns over the last four weeks. The FLR price recovery rally breaking above the 50% Fibonacci level marks a change in trend momentum and the underlying sentiments. This has increased the chances of Flare’s price reaching its 52-week high at $0.056.
Flare Technicals and Price TargetsCurrently, Flare is trading at a discount of 33% from its 52-week highest price, reflecting room for growth. The recovery run has influenced a golden crossover between the 50 and 200-day EMA lines.
Furthermore, the rising 100-day EMA closing its gap with the 200-day EMA line teases a possible crossover. Supporting the bullish trend, the MACD and signal lines have maintained a positive alignment with a streak of rising histograms. Hence, the technical indicators for the Flare price trend are extremely bullish.
Based on the Fibonacci levels, the recovery rally is inching a bullish closer above the 61.80% Fibonacci level. This will target the next immediate resistance at $0.043.
Beyond this, the uptrend in the FLR price trend could end in 2024 at a price level of $0.063, or the 1.272 Fibonacci level. On the flip side, the failure to sustain prices above $0.036 will likely retest the 50% Fibonacci level at $0.03217.
Read More: Flare Price Prediction 2024-2030: Will FLR Price Hit $0.10?
FAQs 1. What is the current resistance level for Flare?The immediate resistance level for FLR is $0.043, with a long-term target of $0.063 at the 1.272 Fibonacci level.
2. What is the key support level for Flare?If FLR fails to sustain above $0.036, the next support lies at $0.03217, which is the 50% Fibonacci retracement level.
3. How much has Flare gained in the last four weeks?FLR has surged by 200% over the last four weeks, starting from $0.012 to its current price of $0.03688.
