Onyxcoin Struggles with Heavy Sell-Offs, Down 57% from January’s ATH
Onyxcoin has been on a persistent downtrend since reaching its all-time high of $0.049 on January 26. Trading at $0.015 at press time, the coin has since shed 57% of its value.
With mounting bearish pressure, the decline may not be over as market indicators signal further downside risks.
XCN Faces Heavy Sell PressureThe steady outflows from XCN’s spot markets over the past month reflect the increased selling activity among its investors. Per Coinglass, in February, the altcoin only recorded four days of inflows, which totaled just $3.5 million. Conversely, XCN spot outflows exceeded $15 million during the same period.
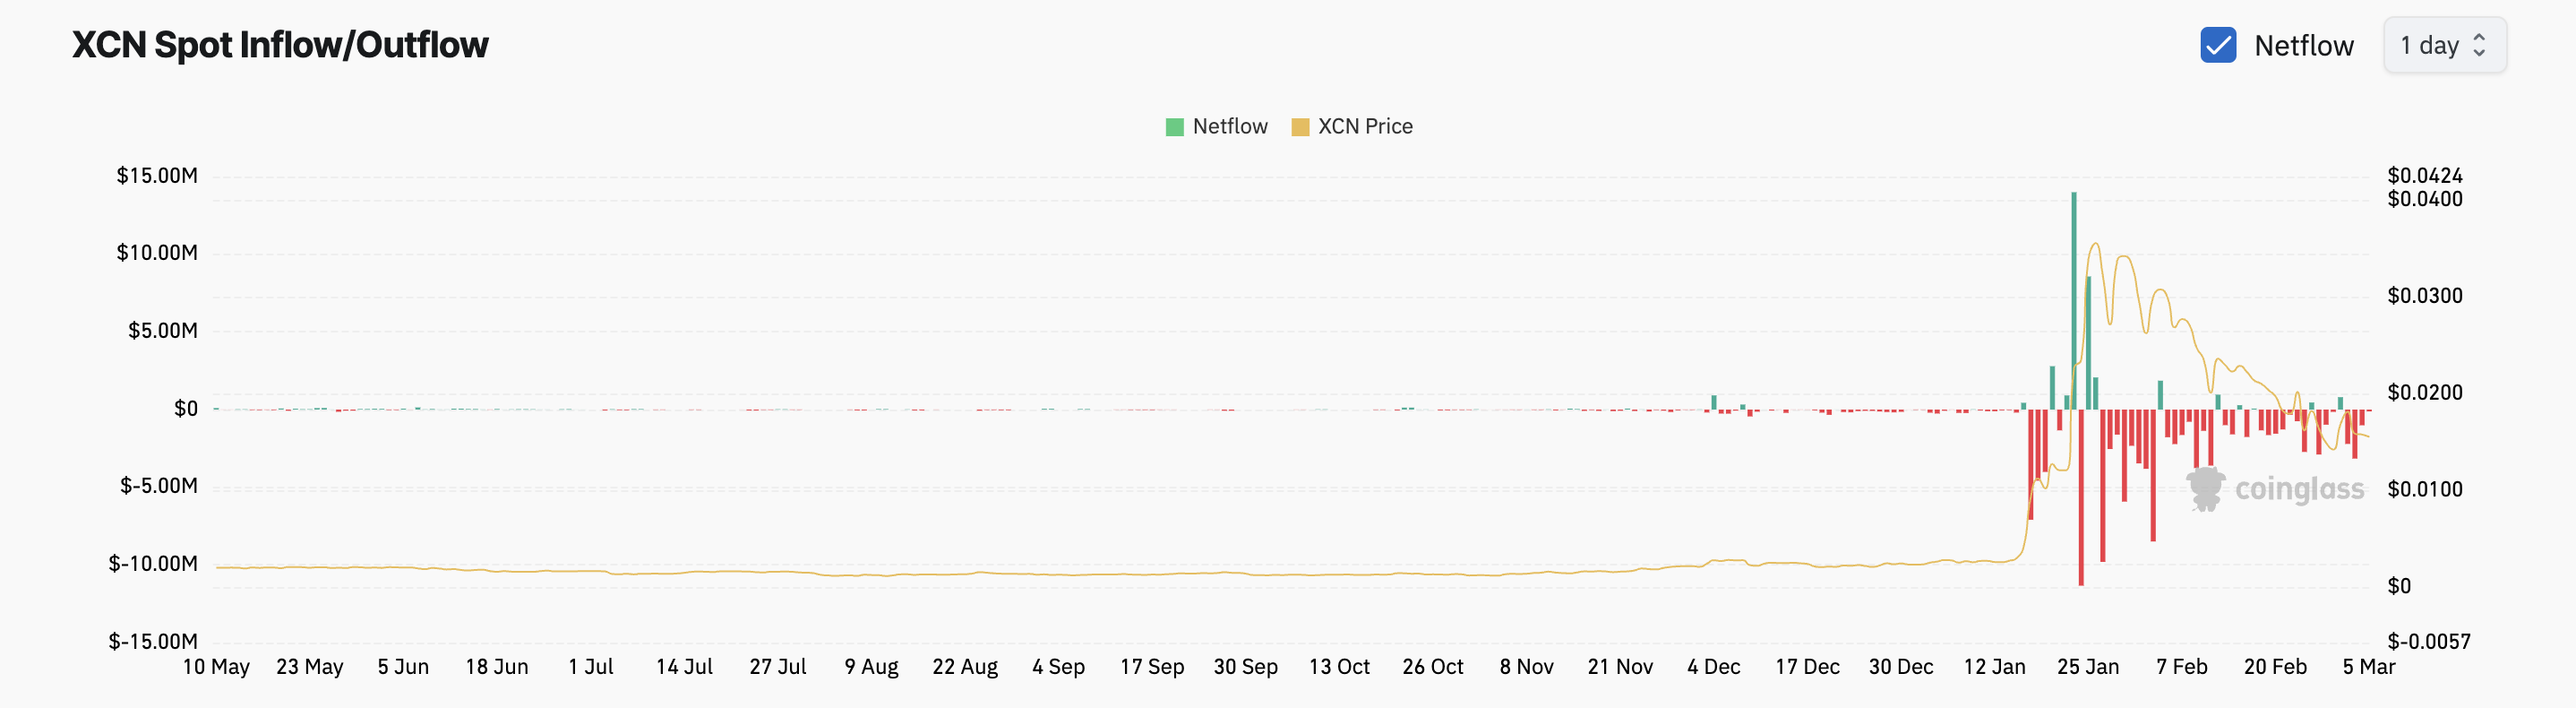 XCN Spot Inflow/Outflow. Source: Coinglass
Outflows from the XCN spot markets have reached $6.45 million so far this month. When an asset records significant spot outflows like this, its investors are selling their holdings.
This trend indicates that profit-taking is significant among XCN traders. It is a sign that there is no new demand for the altcoin, potentially lowering its prices in the short term.
Moreover, its funding rate has been predominantly negative since the beginning of the year, highlighting the bearish bias toward XCN.
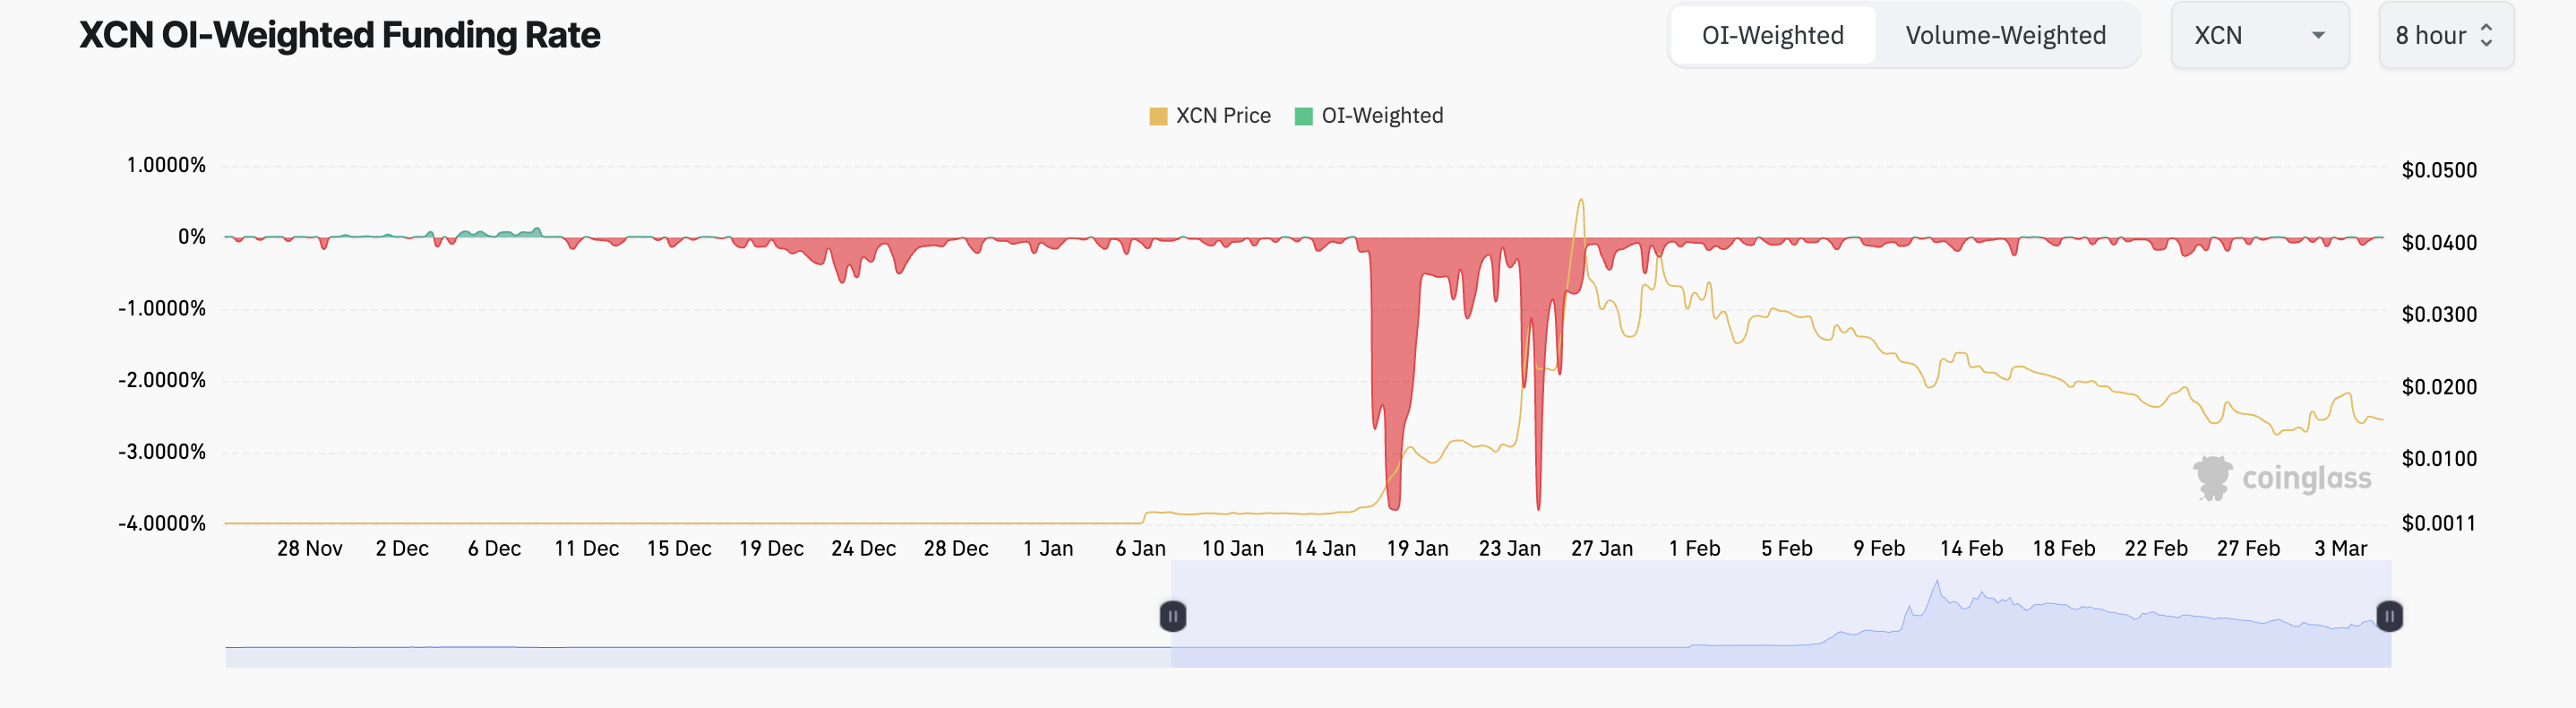 XCN Funding Rate. Source: Coinglass
This periodic fee is exchanged between long and short traders in perpetual futures contracts. It is designed to keep contract prices aligned with the spot market. When persistently negative like this, it means short positions are dominant, indicating traders are betting on further price declines, which can further reinforce bearish sentiment.
XCN Stuck in Downtrend: Will It Break Free or Drop Further?On the daily chart, XCN remains within the descending parallel channel it has traded within since January 26. This bearish pattern is formed when an asset’s price moves between two downward-sloping parallel trendlines, indicating a sustained downtrend.
The pattern suggests that XCN sellers are in control. A drop below the lower trend line, which forms support, hints at further downside. If this happens, XCN’s price could drop to $0.0075.
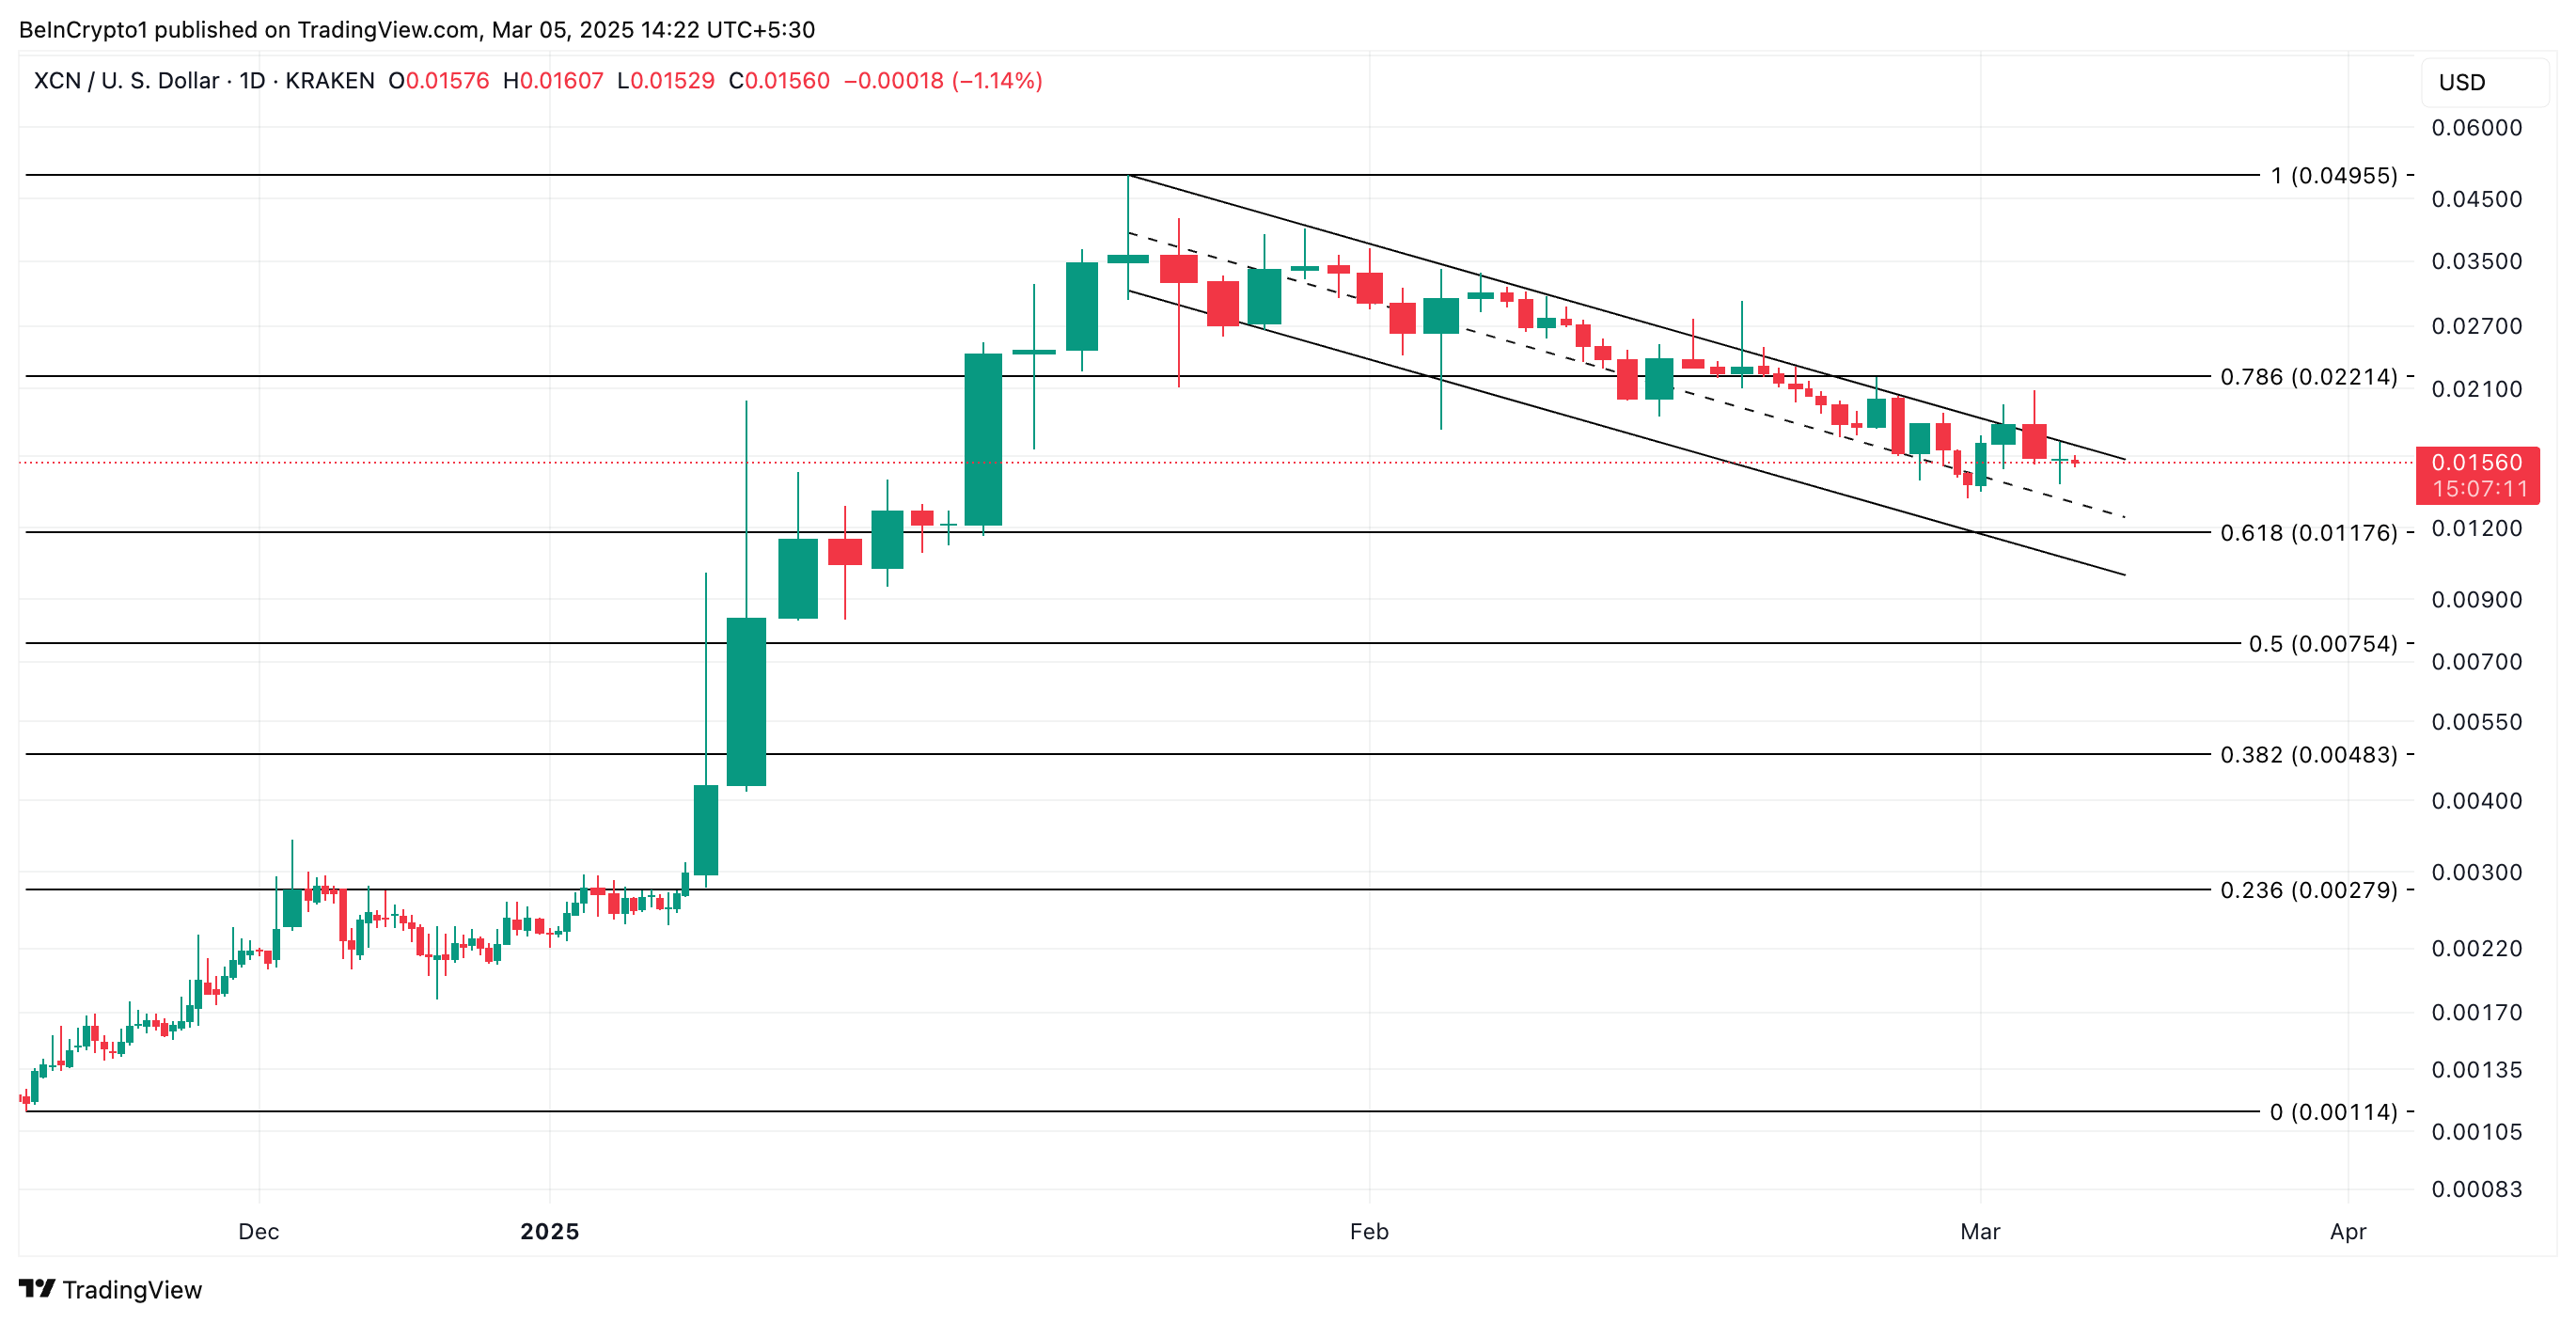 XCN Price Analysis. Source: TradingView
However, a bullish resurgence in the XCN market could prevent this. If new demand soars, the token’s value could climb to $0.022.
The post Onyxcoin Struggles with Heavy Sell-Offs, Down 57% from January’s ATH appeared first on BeInCrypto.