PEPE Breaks Bullish Flag Pattern, Traders Eyes 65% Rally

The post PEPE Breaks Bullish Flag Pattern, Traders Eyes 65% Rally appeared first on Coinpedia Fintech News
Pepe (PEPE), the world’s third-biggest meme coin, is poised for a massive bull run as it has broken out of a bullish price action pattern. Following this breakout, heightened participation from traders and investors has been observed in the past few hours.
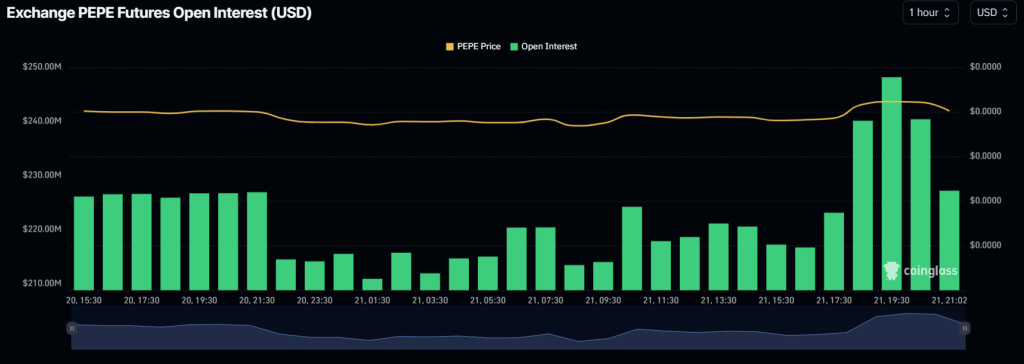
Traders and Whales Fuel PEPE’s Breakout MomentumAccording to the recent report by the on-chain analytics firm Coinglass, PEPE’s open interest (OI) has skyrocketed by 13.56% in the past four hours and 5.6% in the last hour. This growing OI indicates increased trader interest in the meme coin.
 Source: Coinglass
Alongside traders, whales and institutions also appear more engaged, resulting in a significant rise in large transaction volumes, as reported by the on-chain analytics firm IntoTheBlock.
 Source: IntoTheBlock
PEPE Technical Analysis and Upcoming Levels
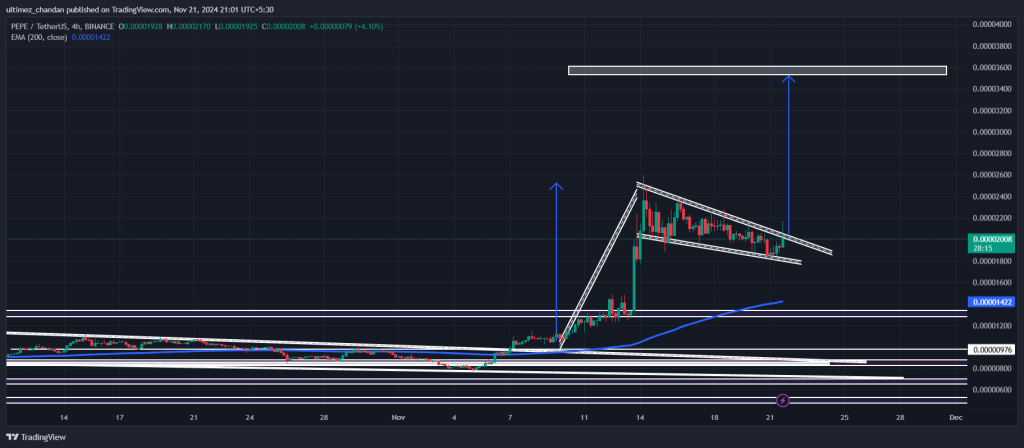
According to CoinPedia’s technical analysis, PEPE has broken out of a bullish flag and pole price action pattern on the four-hour timeframe. In technical analysis, a flag and pole breakout is considered a strong bullish signal, often prompting traders and investors to initiate trades following the breakout.
 Source: Trading View
Based on recent price action and historical momentum, if PEPE successfully closes a four-hour candle above the $0.0000222 level, there is a strong possibility it could surge by 65% to reach the $0.000036 level in the coming days.
However, PEPE’s bullish thesis will remain valid only if the meme coin closes a four-hour candle above the mentioned level, otherwise, it may fail.
Currently, the meme coin is trading above the 200 Exponential Moving Average (EMA) on both the four-hour and daily timeframes. Meanwhile, its Relative Strength Index (RSI) indicates a potential upside rally in the coming days.
Current Price MomentumAt press time, PEPE is trading near $0.000020 and has experienced a price surge of over 5.10% in the past 24 hours. During the same period, its trading volume increased by 18%, indicating heightened participation from traders following the bullish breakout.
