Solana (SOL) 8% Dip Sparks Concerns for 2024 Recovery
Solana’s price has slid another 8% over the past week, casting further doubt on its chances of recovering above the $200 mark as 2024 draws to a close.
Currently trading at $161.45, Solana’s technical indicators show mounting selling pressure. This analysis delves into how low SOL’s price may fall in the mid-term.
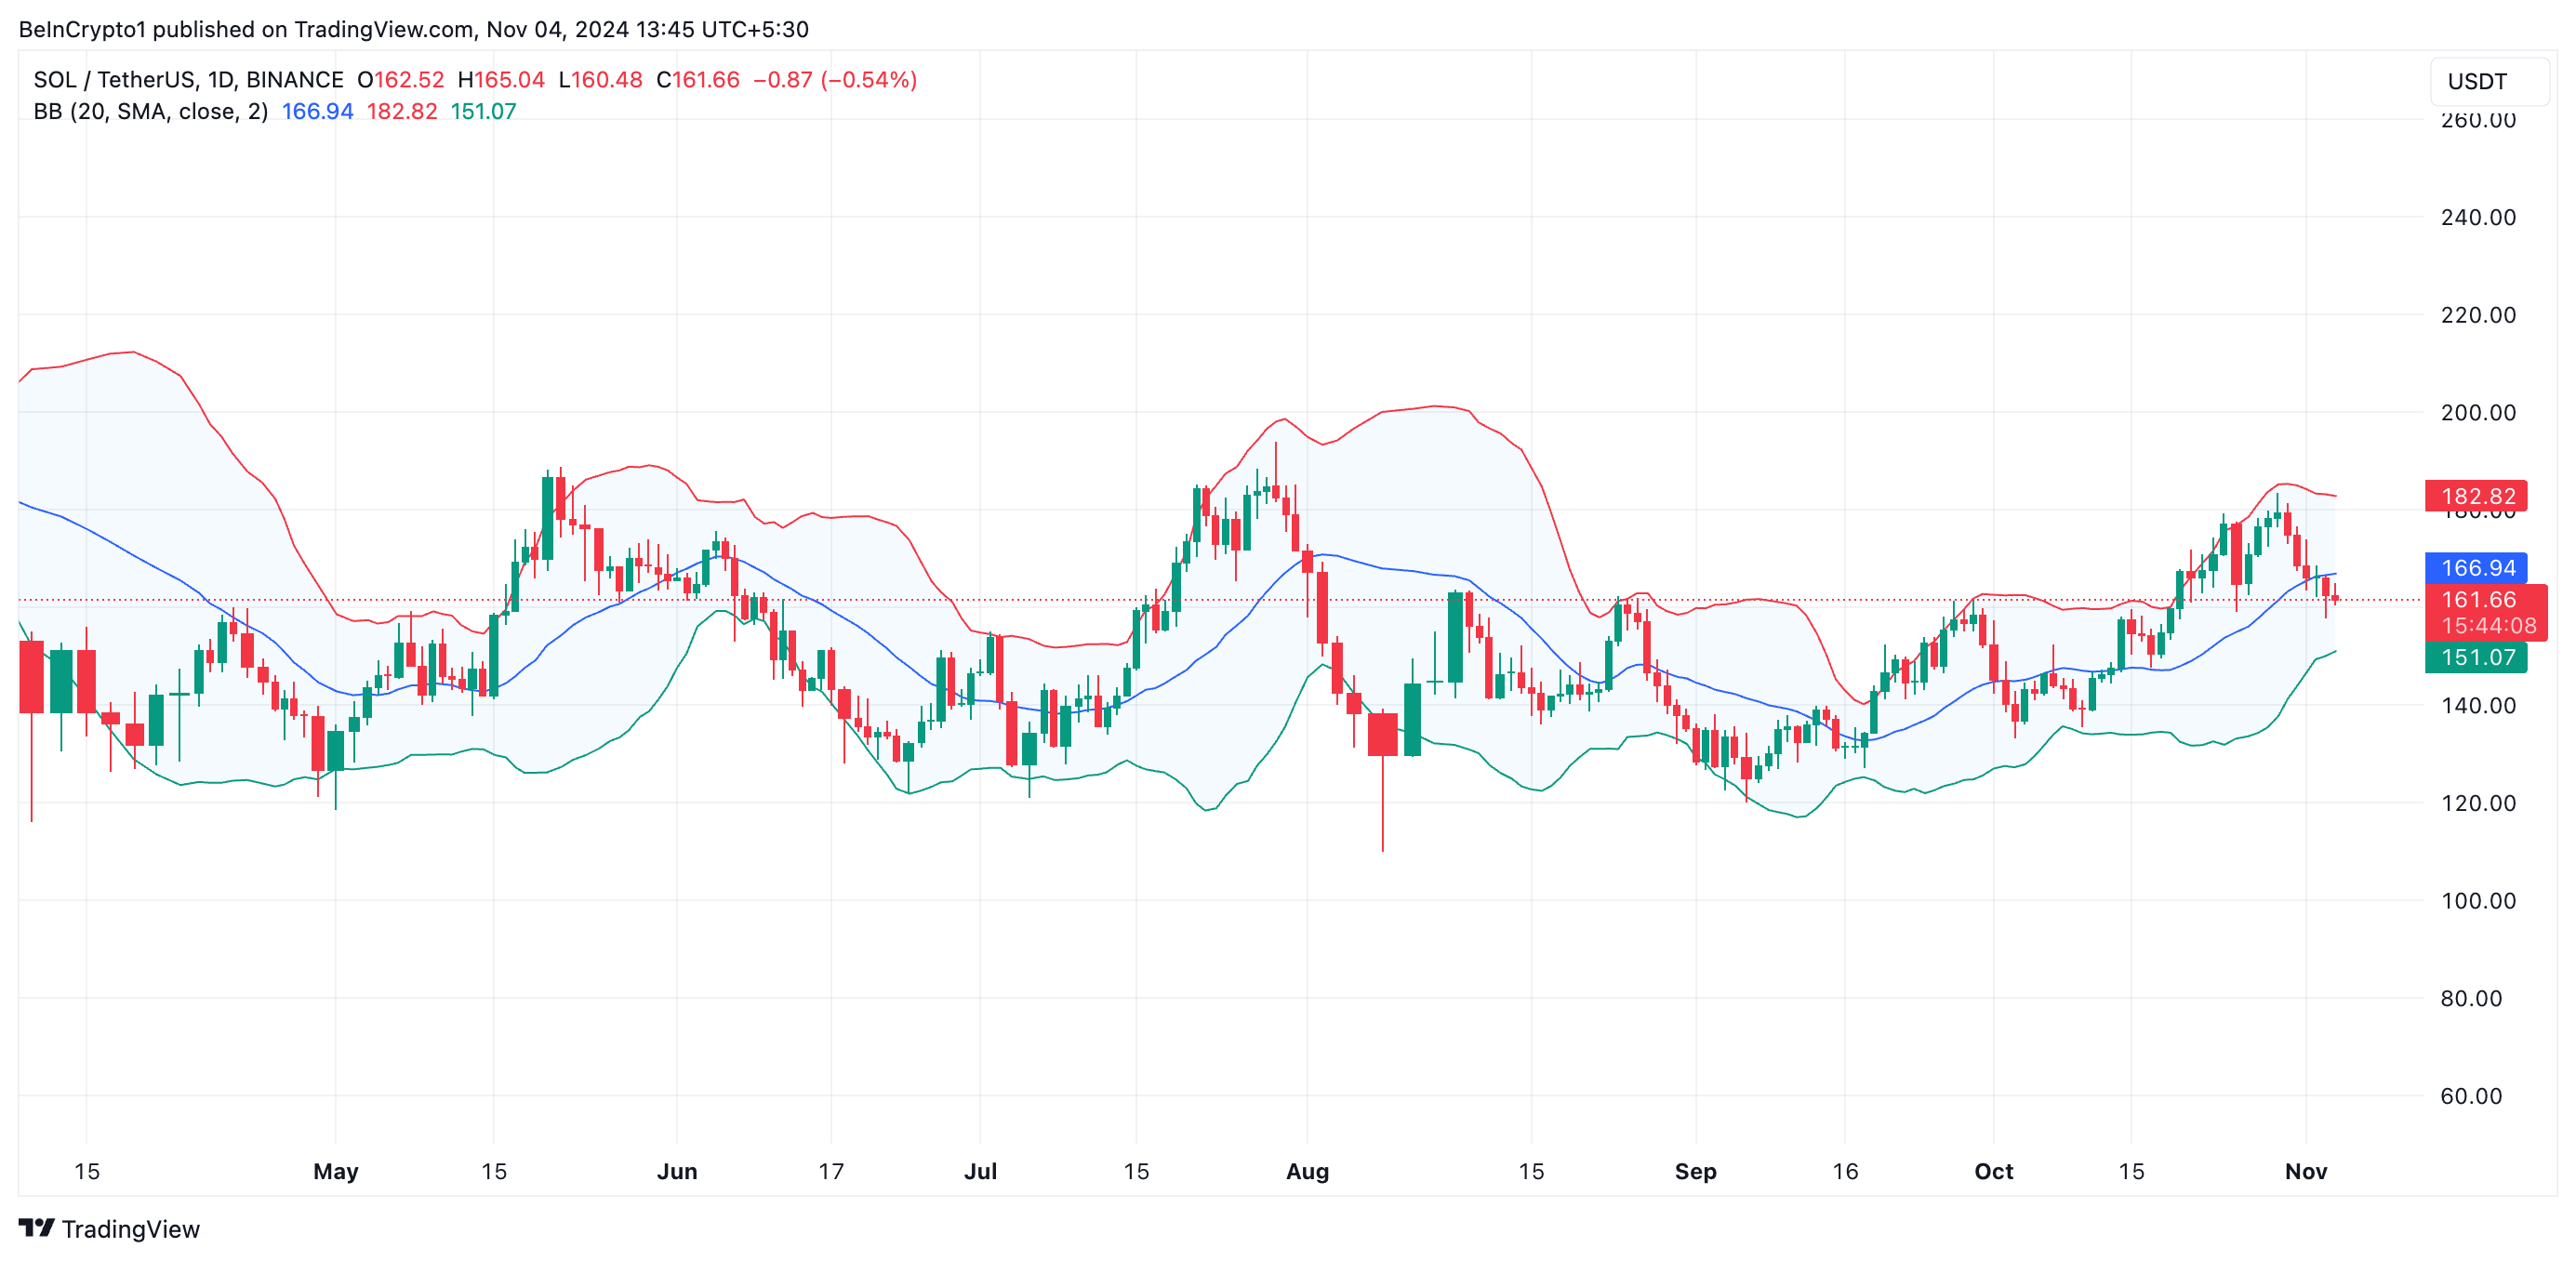
Solana Bulls Give Up ControlBeInCrypto’s assessment of the SOL/USD chart shows that Solana is currently trading near the lower band of its Bollinger Bands indicator, revealing a spike in selling pressure.
The Bollinger Bands indicator measures market volatility and identifies potential buy and sell signals. It consists of three main components: the middle band, the upper band, and the lower band.
The middle band is a 20-period moving average that serves as a baseline for the price trend. The upper band is calculated as the middle band plus two standard deviations of the price, accounting for price volatility above the moving average. Conversely, the lower band is the middle band minus two standard deviations of the price, representing volatility below the moving average.
Read more: 7 Best Platforms To Buy Solana (SOL) in 2024
 Solana Bollinger Bands. Source: TradingView
When an asset’s price approaches the lower band of its Bollinger Bands, it suggests a downtrend and strong selling pressure. Traders often see this as a signal to avoid opening long positions, as the price could continue to decline.
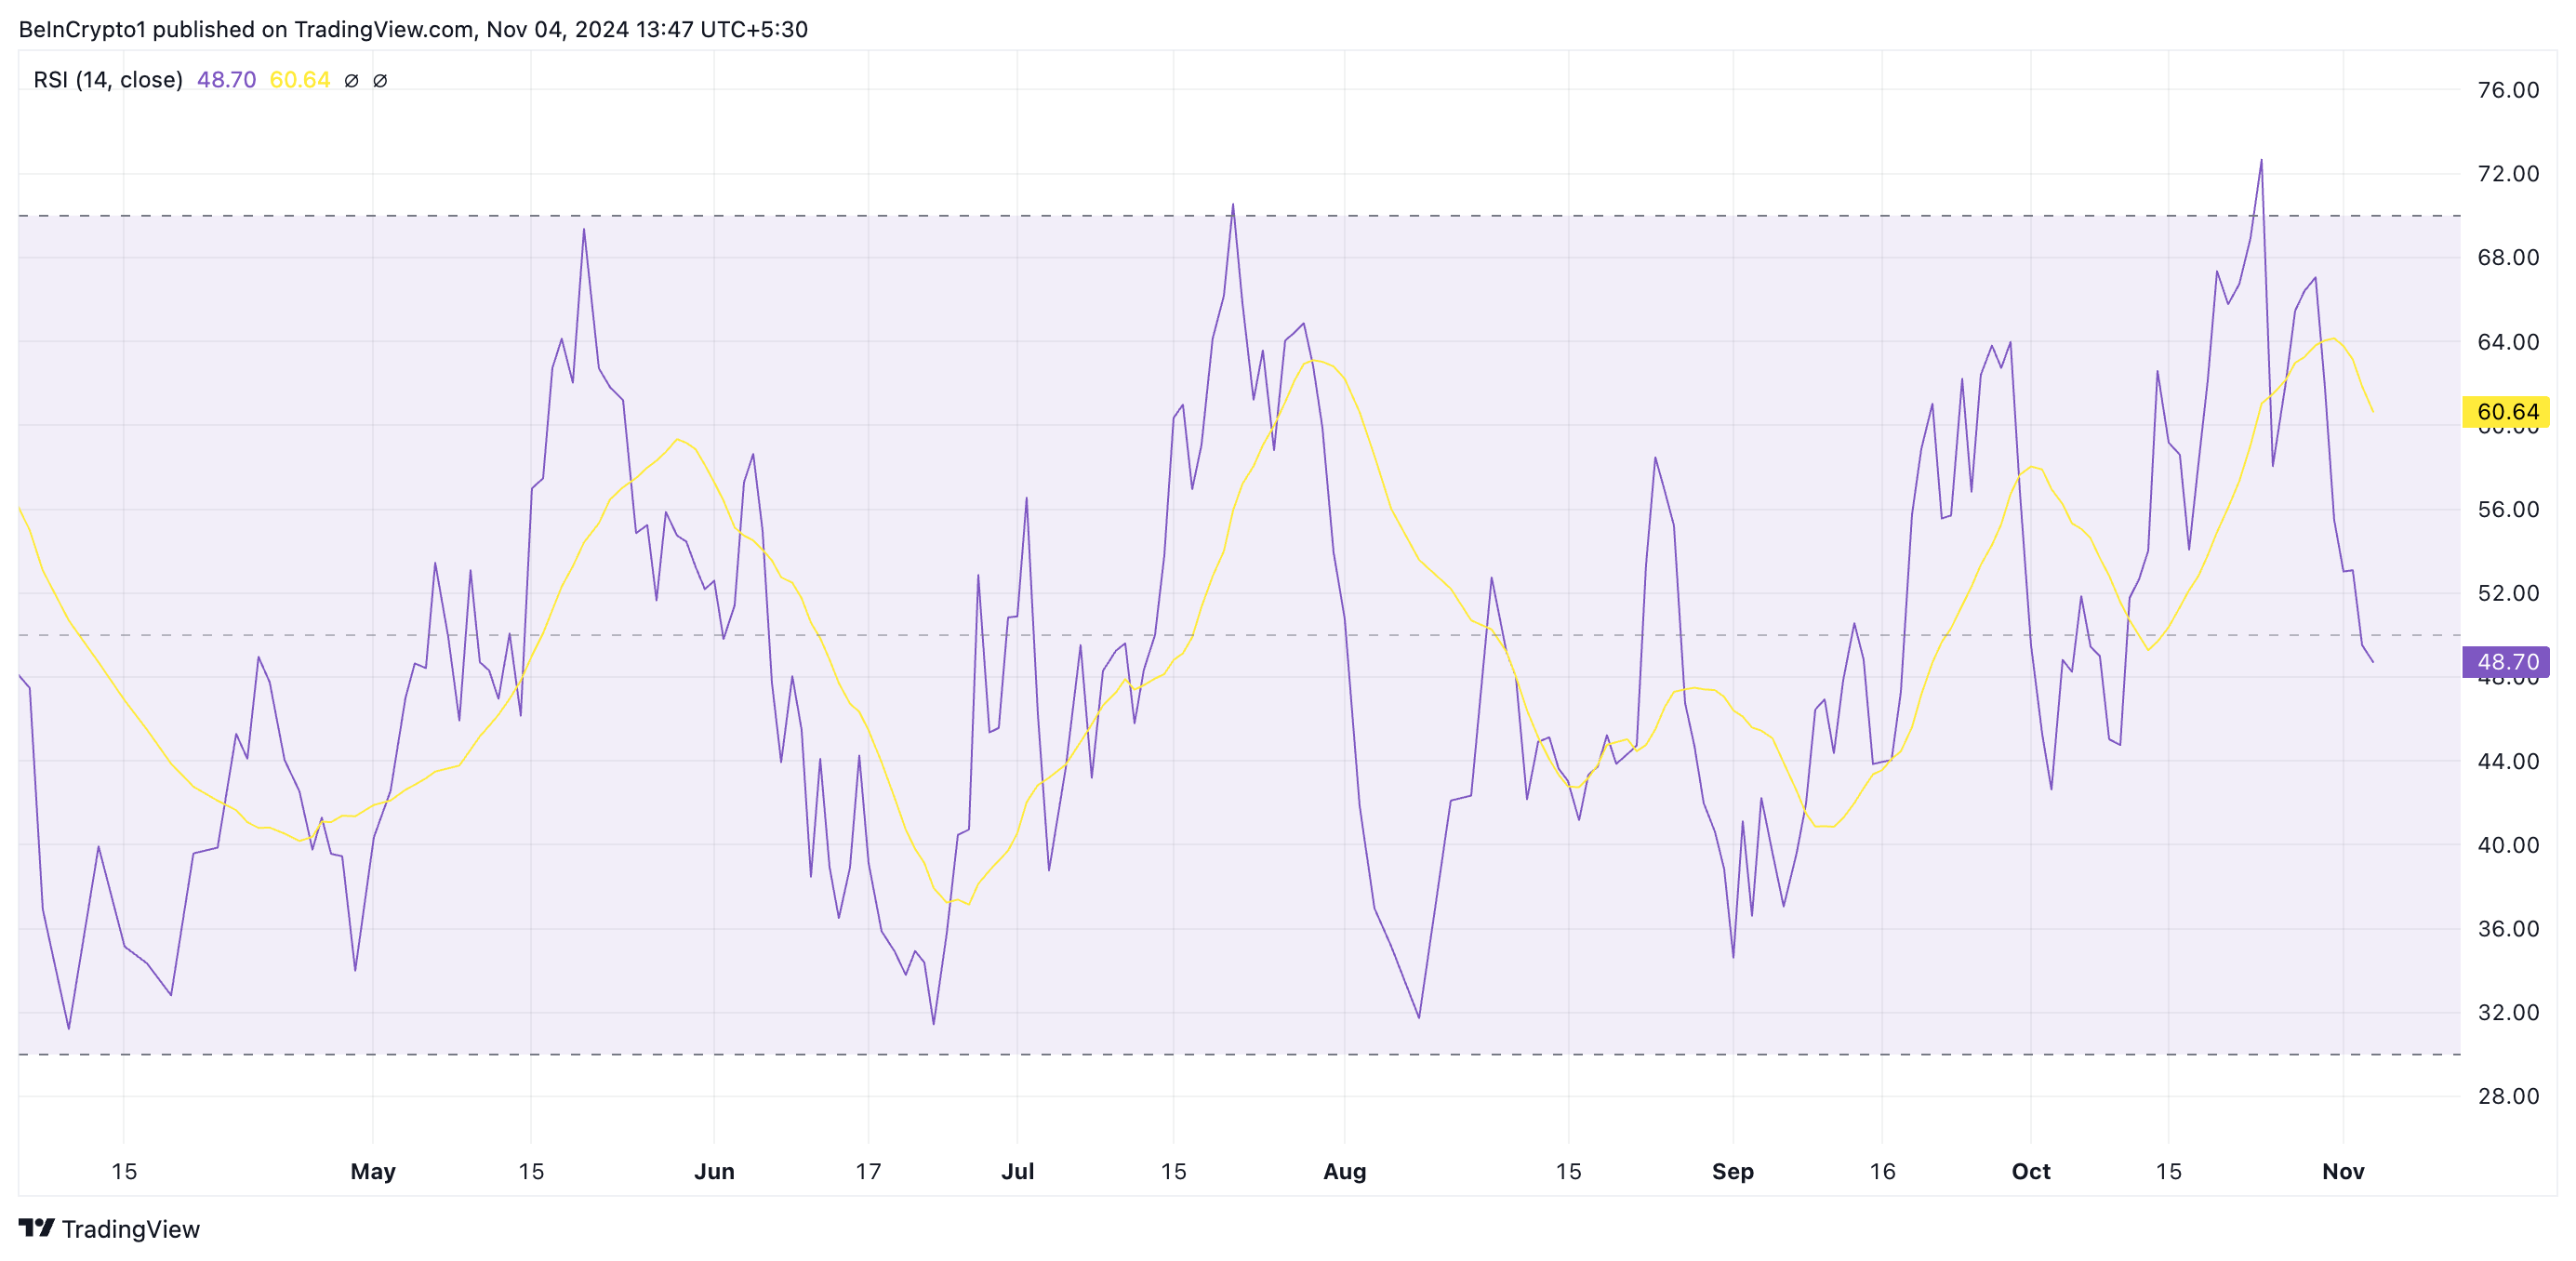
Solana’s Relative Strength Index (RSI) readings further confirm this bearish outlook. Currently, the RSI — a measure of whether an asset is oversold or overbought — is trending downward at 48.70. This indicates that selling pressure is building and surpasses buying interest, increasing the likelihood of further declines in Solana’s price.
 Solana RSI. Source: TradingView
SOL Price Prediction: Key Support Level to Watch
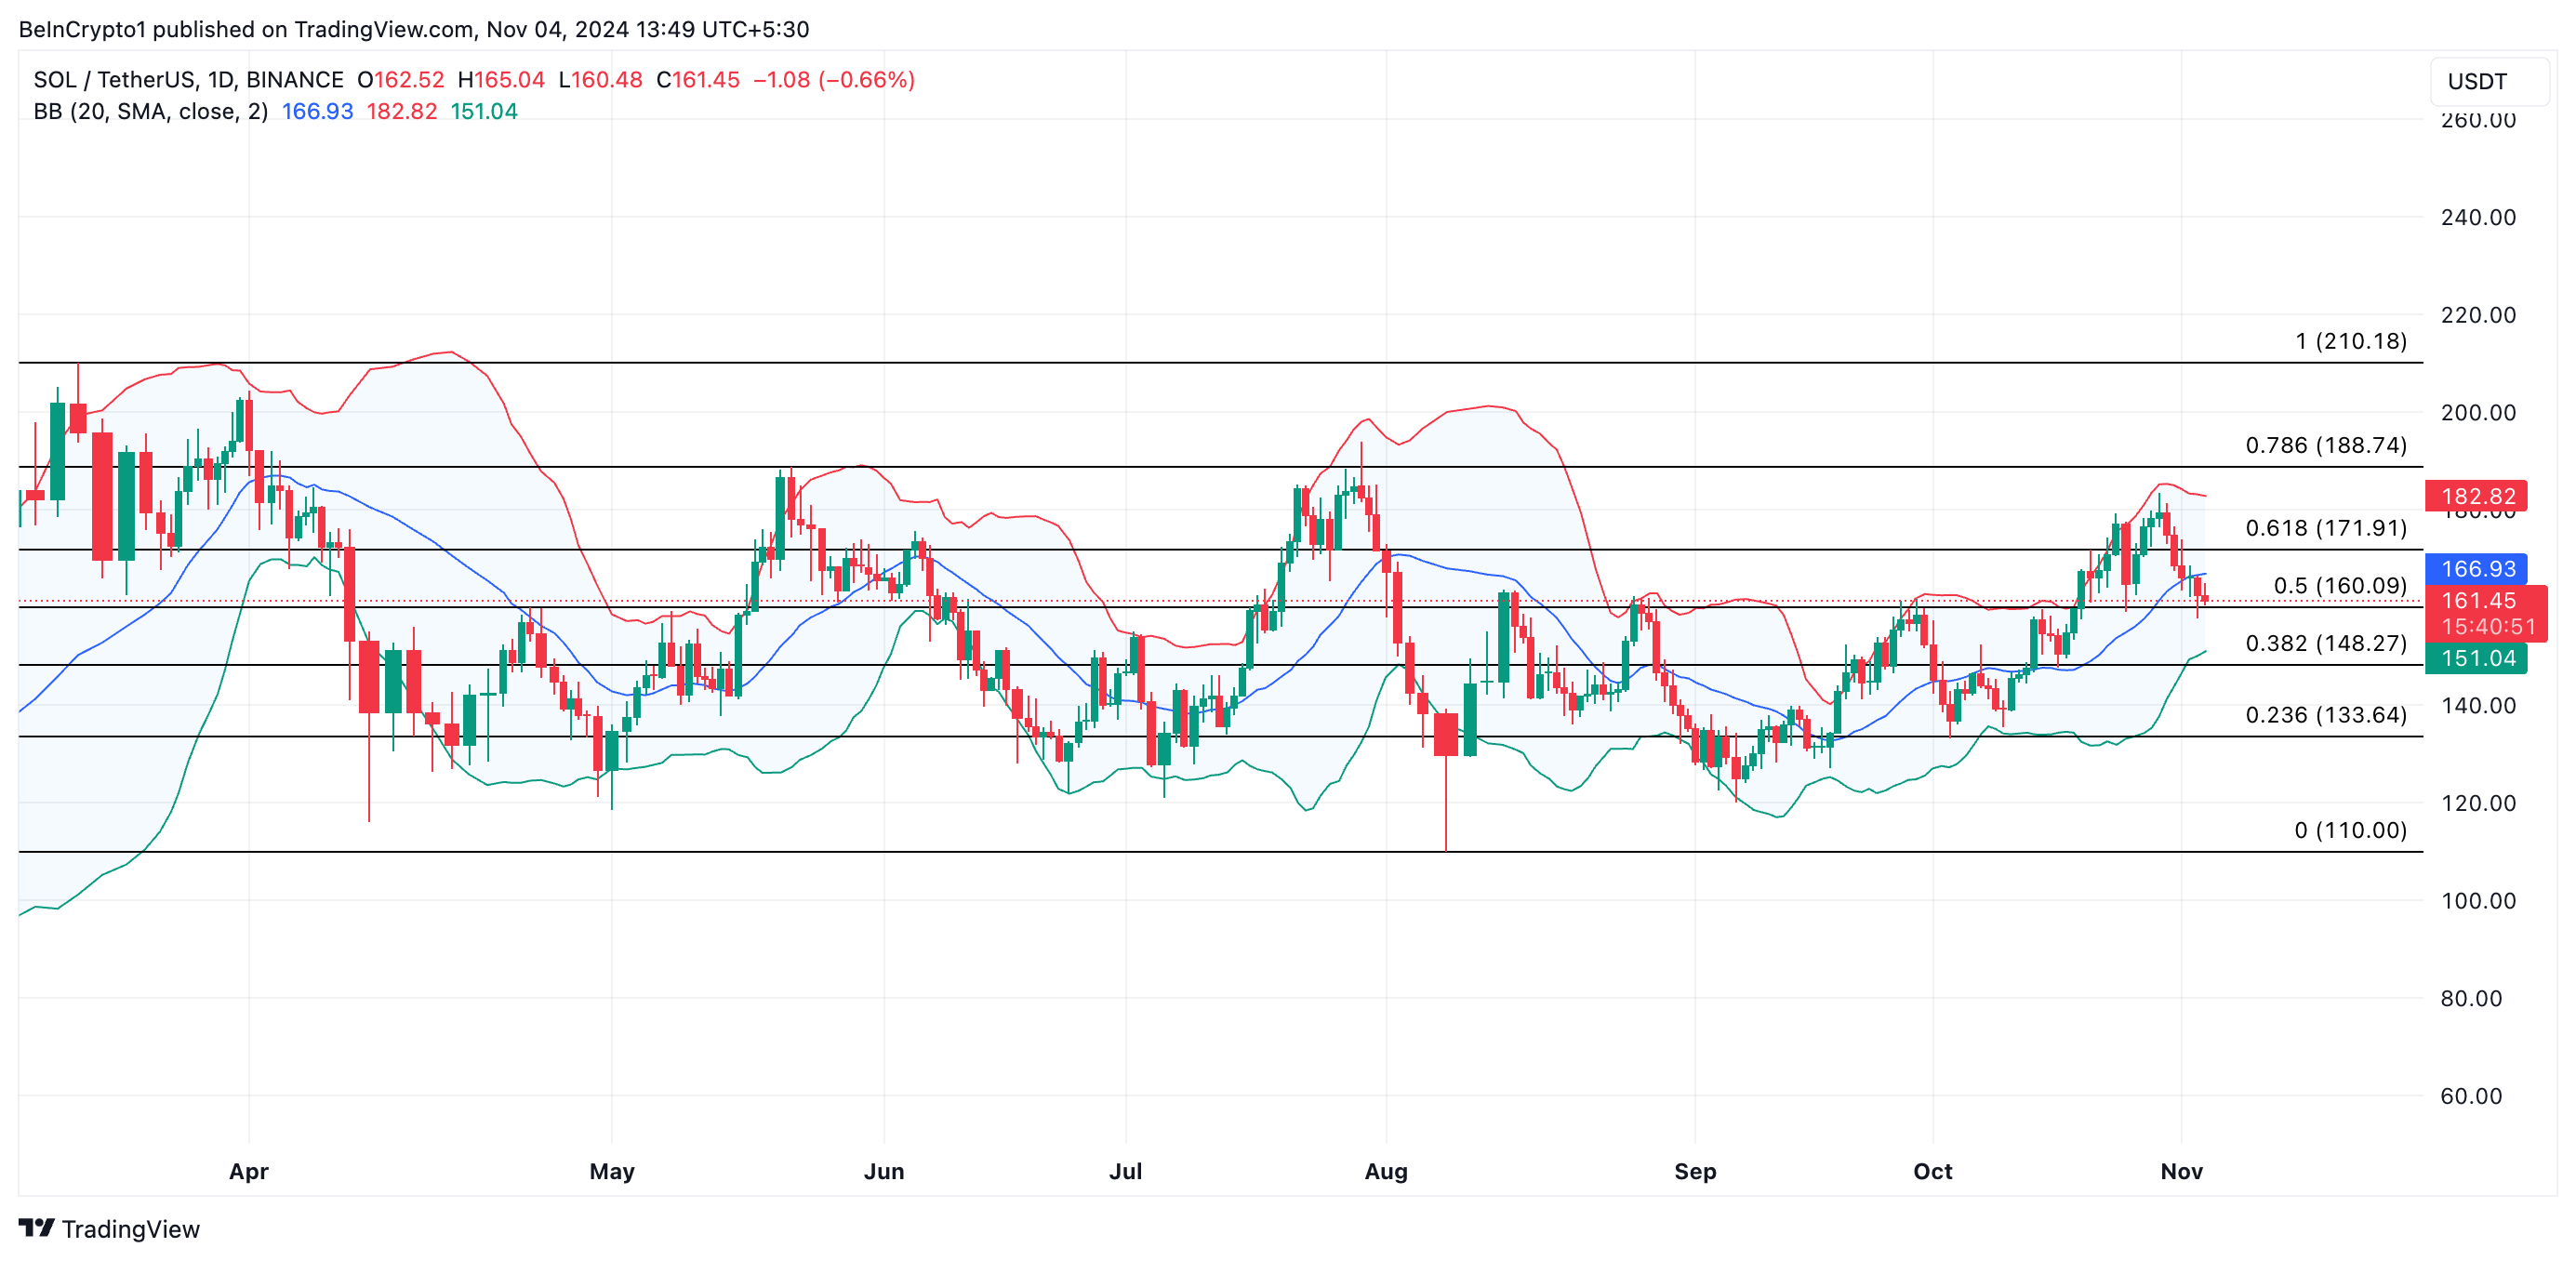
SOL is currently trading at $161.45, nearing the lower band of its Bollinger Bands at $151.04. Traders often view this lower band as a potential support level. A break below this point would signal increased bearish momentum, suggesting that support has failed and potentially extending Solana’s decline to $133.64.
Read more: Solana (SOL) Price Prediction 2024/2025/2030
 Solana Price Analysis. Source: TradingView
Conversely, if SOL bounces off the lower band, it reinforces the band as a support level and could signal the start of an uptrend. In this case, Solana’s price might target the upper Bollinger Band at $182.82, challenging the bearish outlook.
The post Solana (SOL) 8% Dip Sparks Concerns for 2024 Recovery appeared first on BeInCrypto.
