Why Is the Crypto Market Up Today?
The cryptocurrency market continues its upward trend today, with total crypto market cap (TOTAL) and Bitcoin (BTC) clinching new all-time highs. The FTX token (FTT) emerged as the top performer over the past 24 hours, noting a 41% uptick.
In the news today:-
- During the early trading session on Friday, Solana (SOL) surged to a new all-time high (ATH), trading around $262, surpassing its previous record set in November 2021.
- The now-defunct cryptocurrency exchange FTX revealed that its court-approved reorganization plan will take effect in January 2025. In the coming month, FTX debtors will finalize agreements with distributors to facilitate reimbursements for former users, particularly those based overseas.
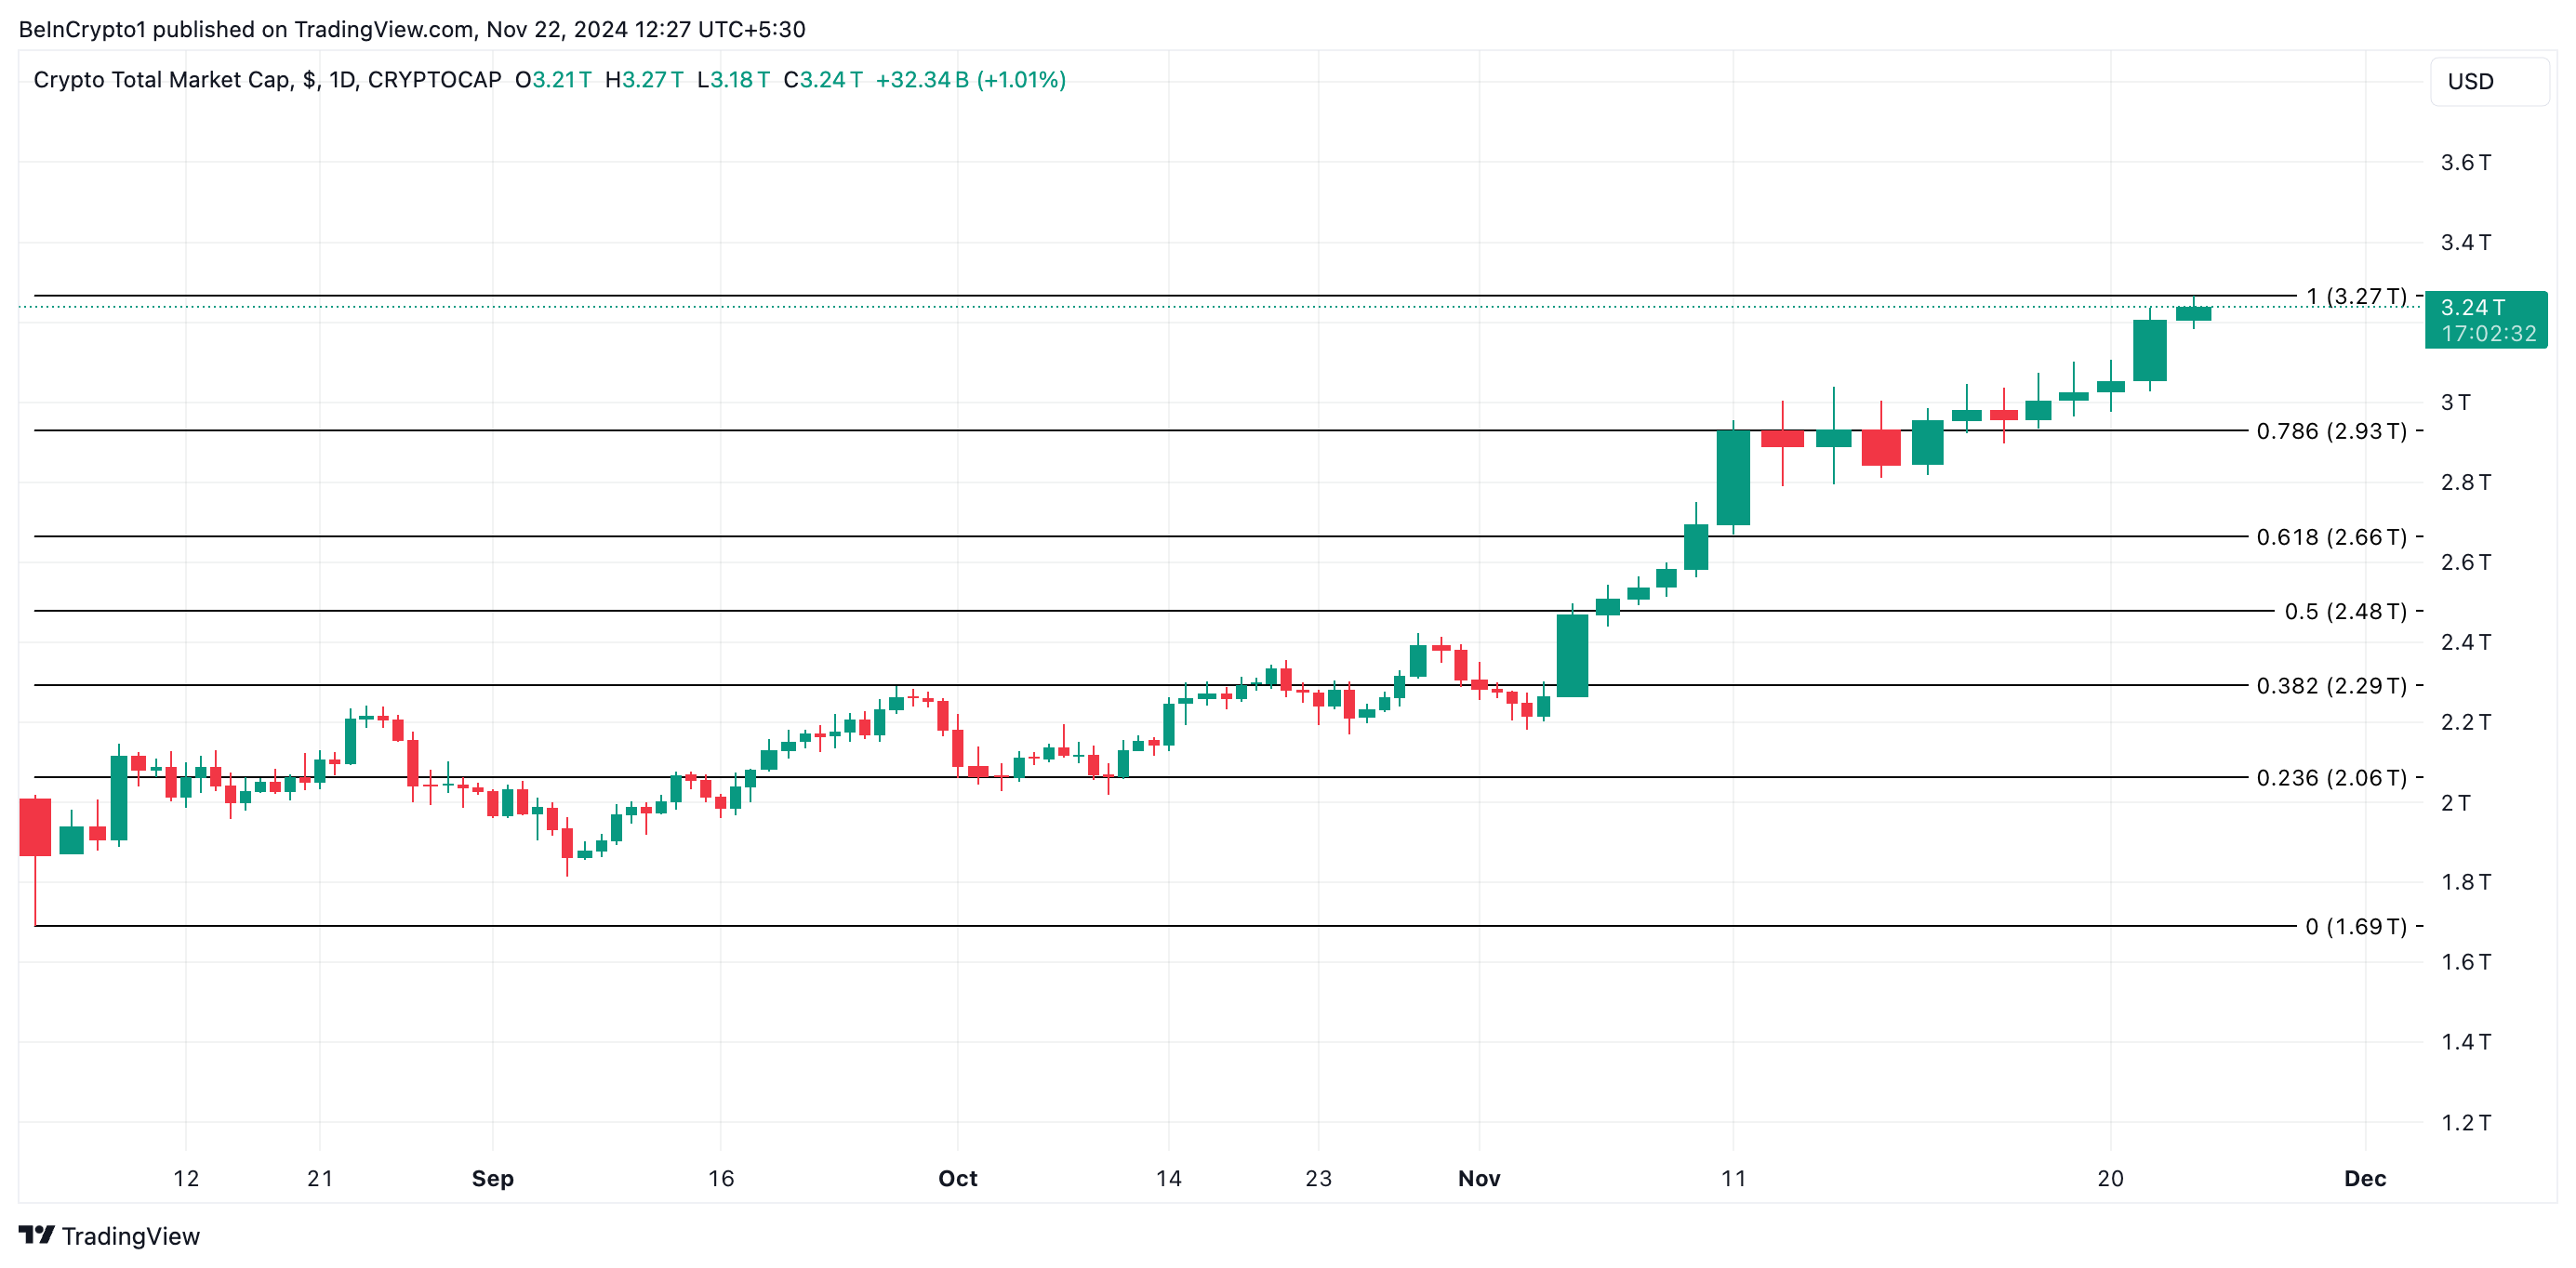
The cryptocurrency market remains on an upward trend, with total capitalization climbing by 4% over the past 24 hours. During Friday’s early trading session, the overall market cap briefly climbed to an all-time high of $3.27 trillion before witnessing a slight pullback. As of this writing, it stands at $3.24 trillion.
While this high market capitalization signals high trading activity, the Crypto Fear and Greed Index readings hint at the possibility of a pullback in the near term. At press time, the index is 94, signaling extreme greed in the market.
Generally, when the market is in a state of extreme greed, it reflects a highly bullish sentiment, with investors showing significant optimism and willingness to take on risk. However, historically, such high levels can indicate potential overheating as markets may be approaching a local top or a period of correction.
If bullish momentum wanes, TOTAL may fall to support at $2.93 trillion. A breach of this support level will cause a further decline toward $2.66 trillion.
 Total Crypto Market Cap Analysis. Source: TradingView
However, if the current uptrend persists, TOTAL will reclaim its all-time high of $3.27 trillion and attempt to touch new highs in the short term.
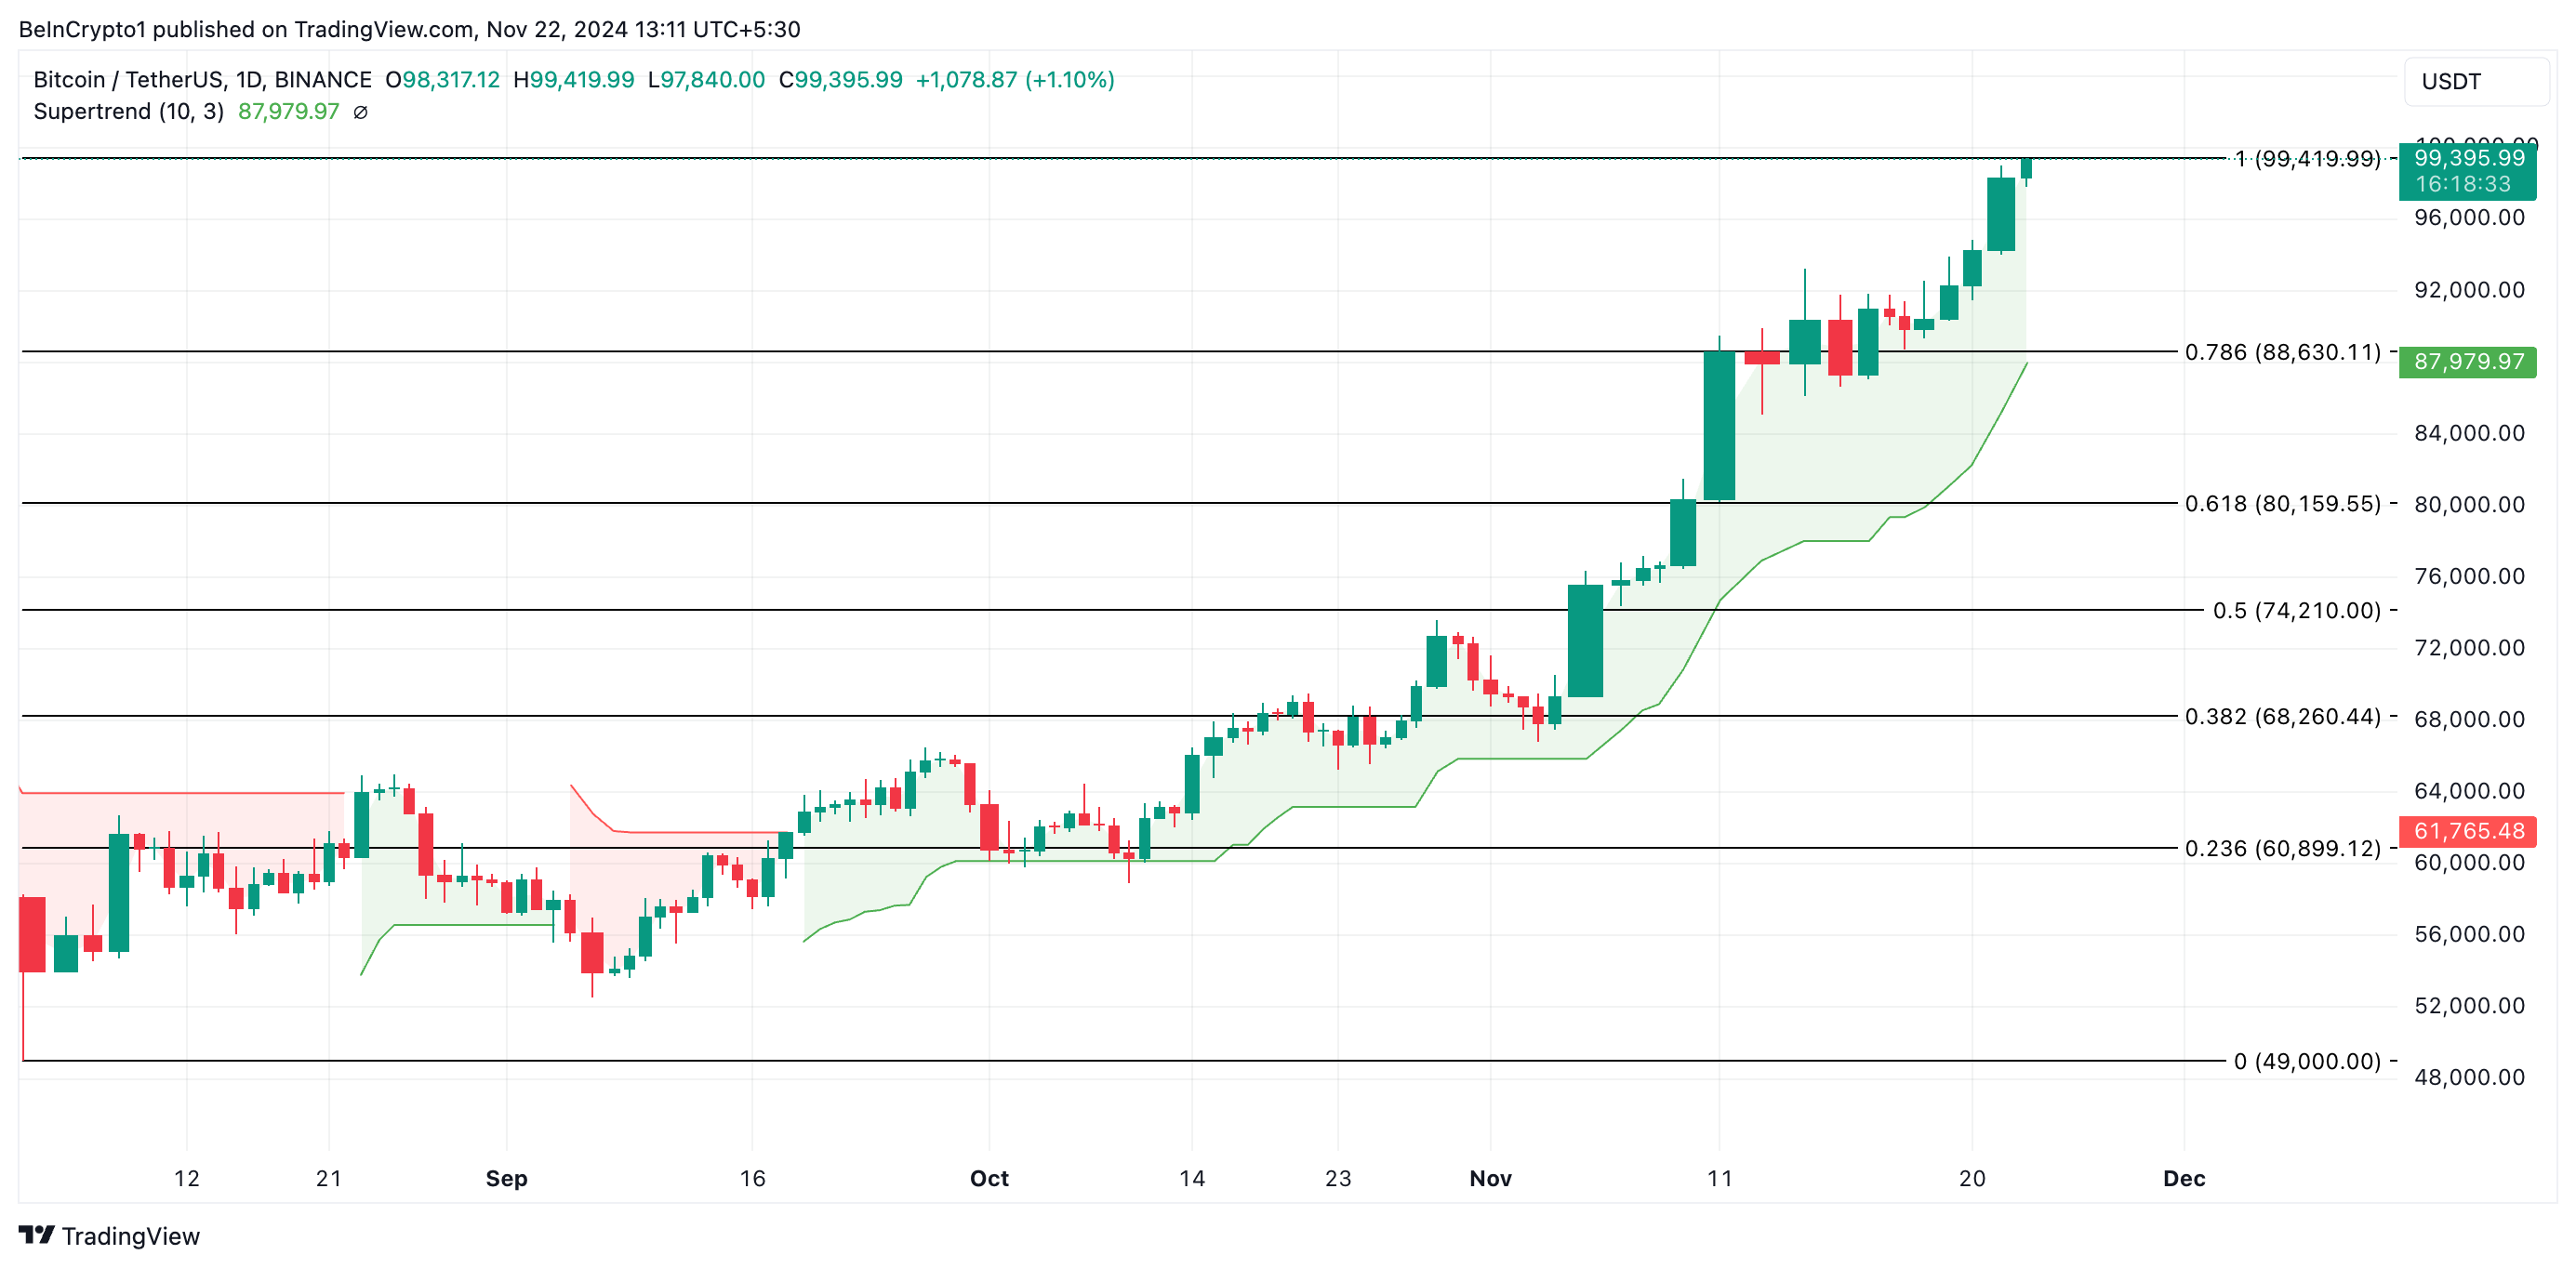
Bitcoin is 1% Shy of the $100,000 Price MarkThe leading coin, Bitcoin, currently trades at $99,395, registering a 2% price growth over the past 24 hours. BeInCrypto’s assessment of the BTC/USD one-day chart reflects the sustained bullish bias toward the coin. For example, as of this writing, the meme coin’s price is above the green line of its Super Trend indicator.
The Super Trend indicator tracks a trend’s overall direction and strength in asset prices. It appears as a line on the price chart, which changes color based on the trend direction: red for a downtrend and green for an uptrend. When the Super Trend line is above the asset’s price, it signals a downtrend, suggesting that bearish momentum will continue.
As in BTC’s case, buyers are in control when the Super Trend line turns green and appears below an asset’s price. The green line acts as a support floor where an asset’s price may witness a surge in buying pressure and a rebound following a dip. For BTC, this stands at $87,979.
 Bitcoin Price Analysis. Source: TradingView
If the uptrend continues, BTC will hit the highly anticipated $100,000 price mark and rally past it. On the other hand, if profit-taking activity spikes, the coin’s price may fall to $88,630, its next major support.
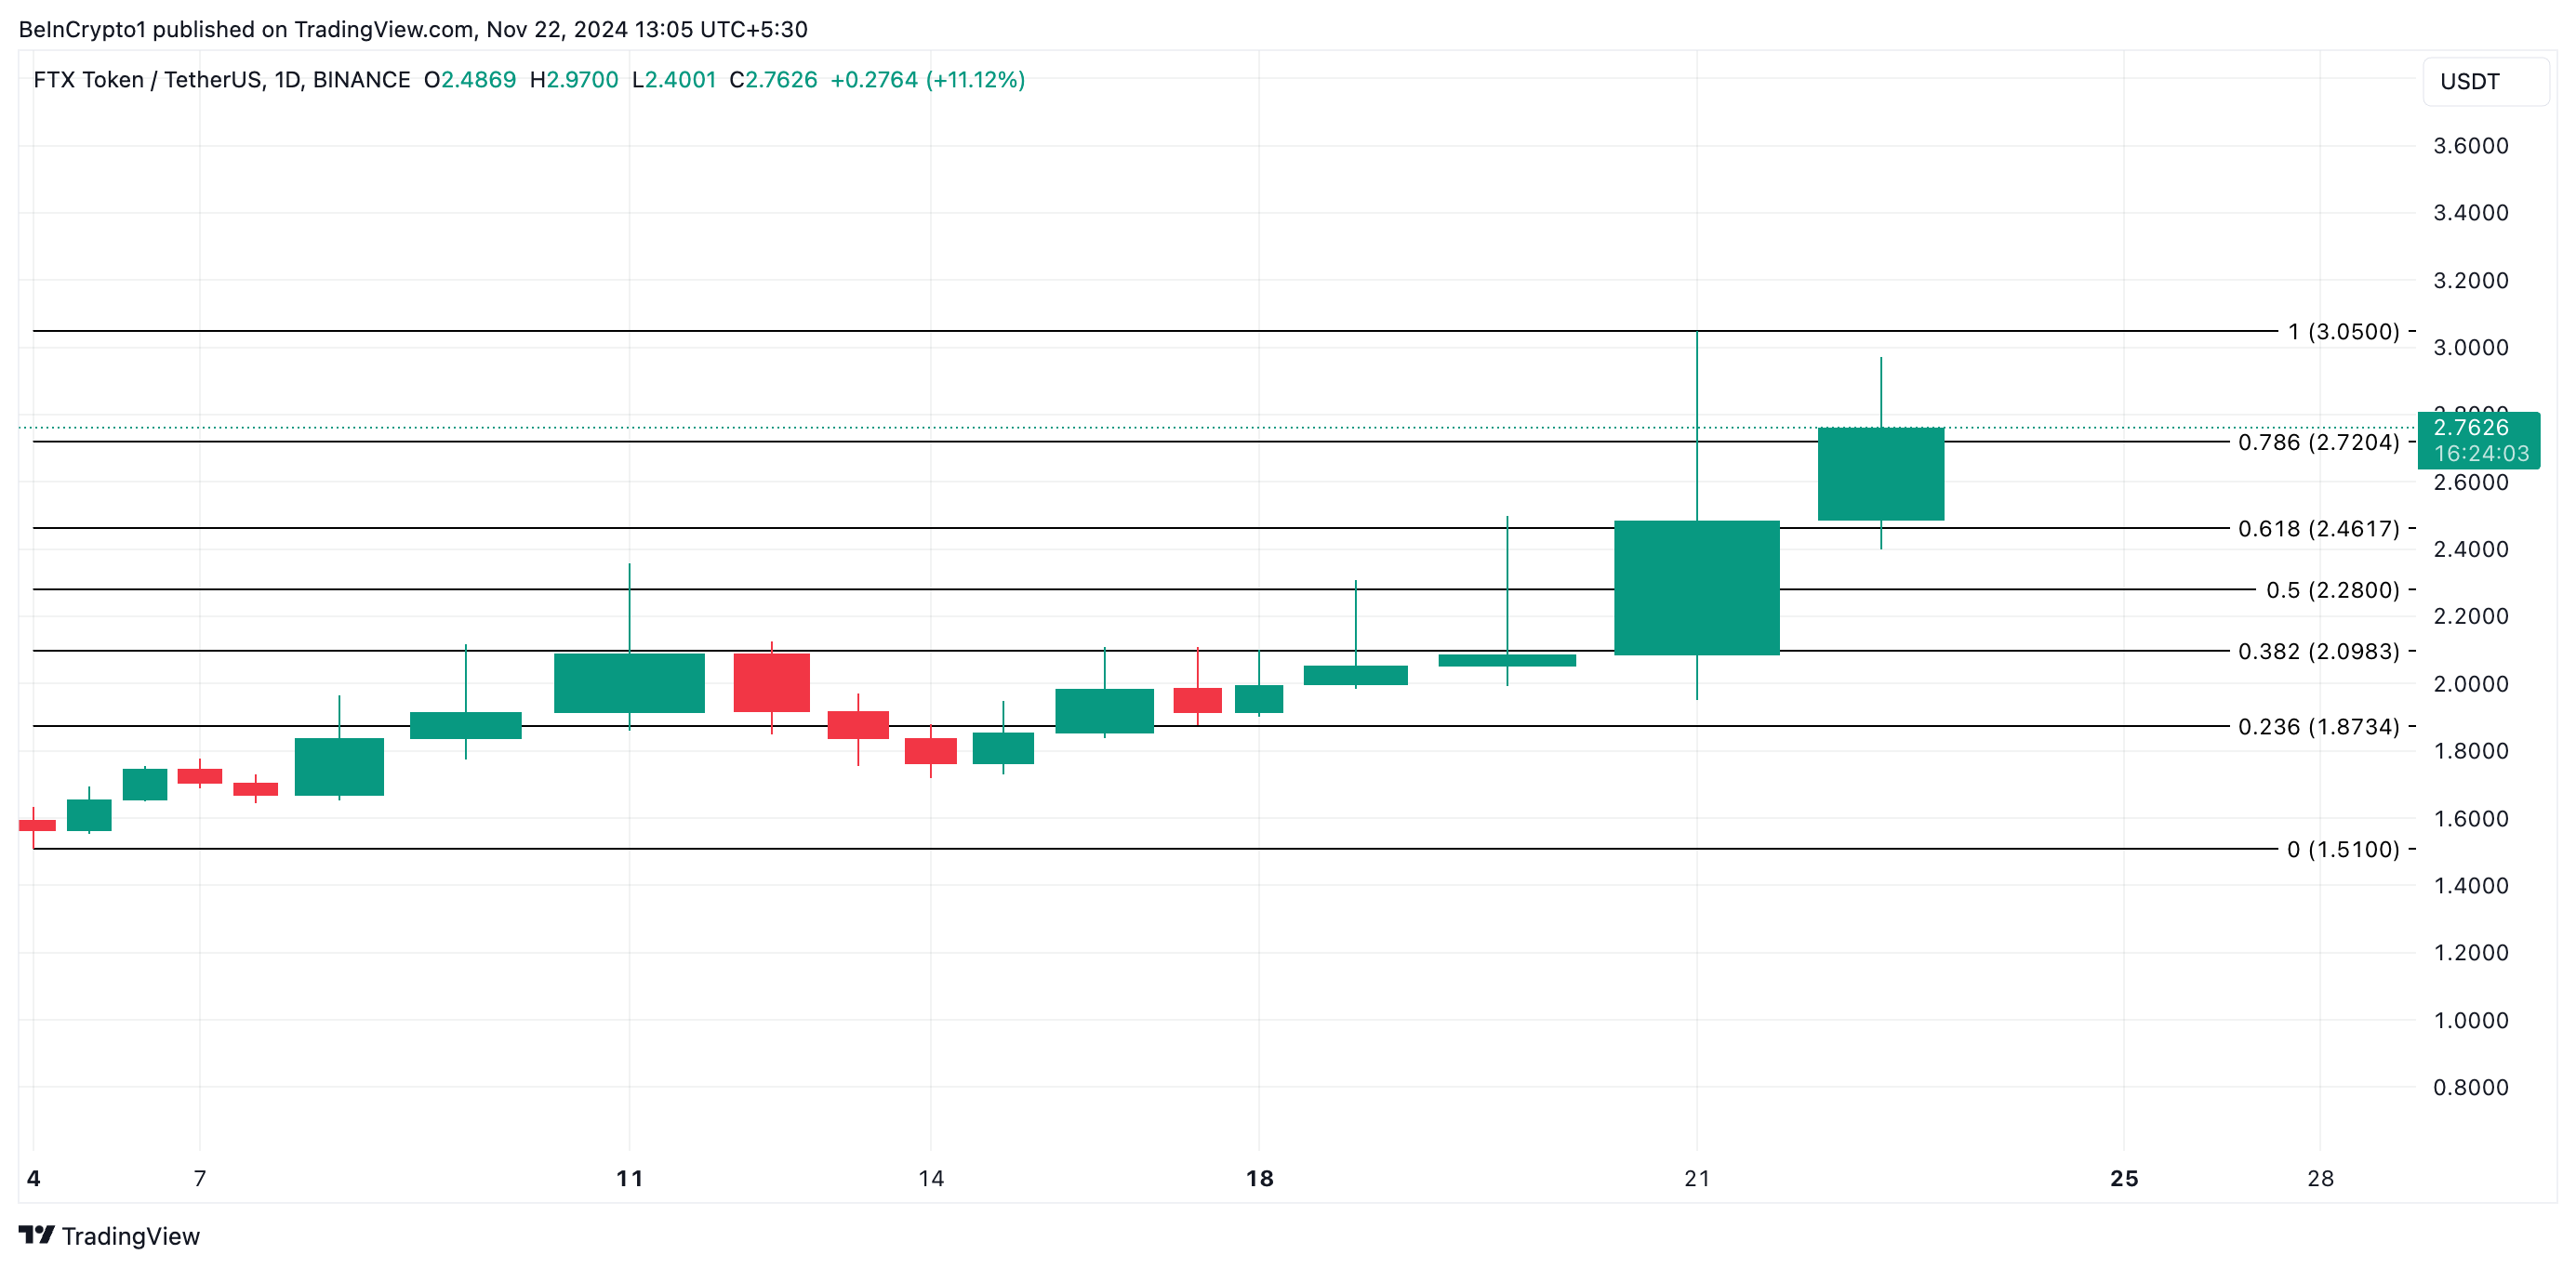
FTT Leads Market GainsFTT’s price has jumped nearly 41% in the past 24 hours, making it the best-performing altcoin among the top 100. The altcoin trades at $2.76, slightly above support formed at $2.72.
FTT’s double-digit rally has been accompanied by a 218% uptick in trading volume. When a surge in trading volume accompanies a price increase, it indicates strong market interest and momentum behind the move, suggesting the price action is backed by significant participation from traders.
 FTT Price Analysis. Source: TradingView
If buying momentum is maintained, FTT’s price may reclaim its seven-day high of $3.05, which it traded at on Thursday. However, a decline in buying momentum may result in a breach of the $2.72 support level and a decline toward $2.46.
The post Why Is the Crypto Market Up Today? appeared first on BeInCrypto.
