AIXBT’s Attempt to Hit $0.36 All-Time High Fails Amid Bearish Pressure
AIXBT saw a significant surge in value during Monday’s early Asian session, rallying towards its all-time high of $0.36. However, it peaked at $0.33 before facing a wave of sell-offs, placing downward pressure on its price.
Currently trading at $0.28, the altcoin seems likely to extend its decline as buying pressure continues to fade.
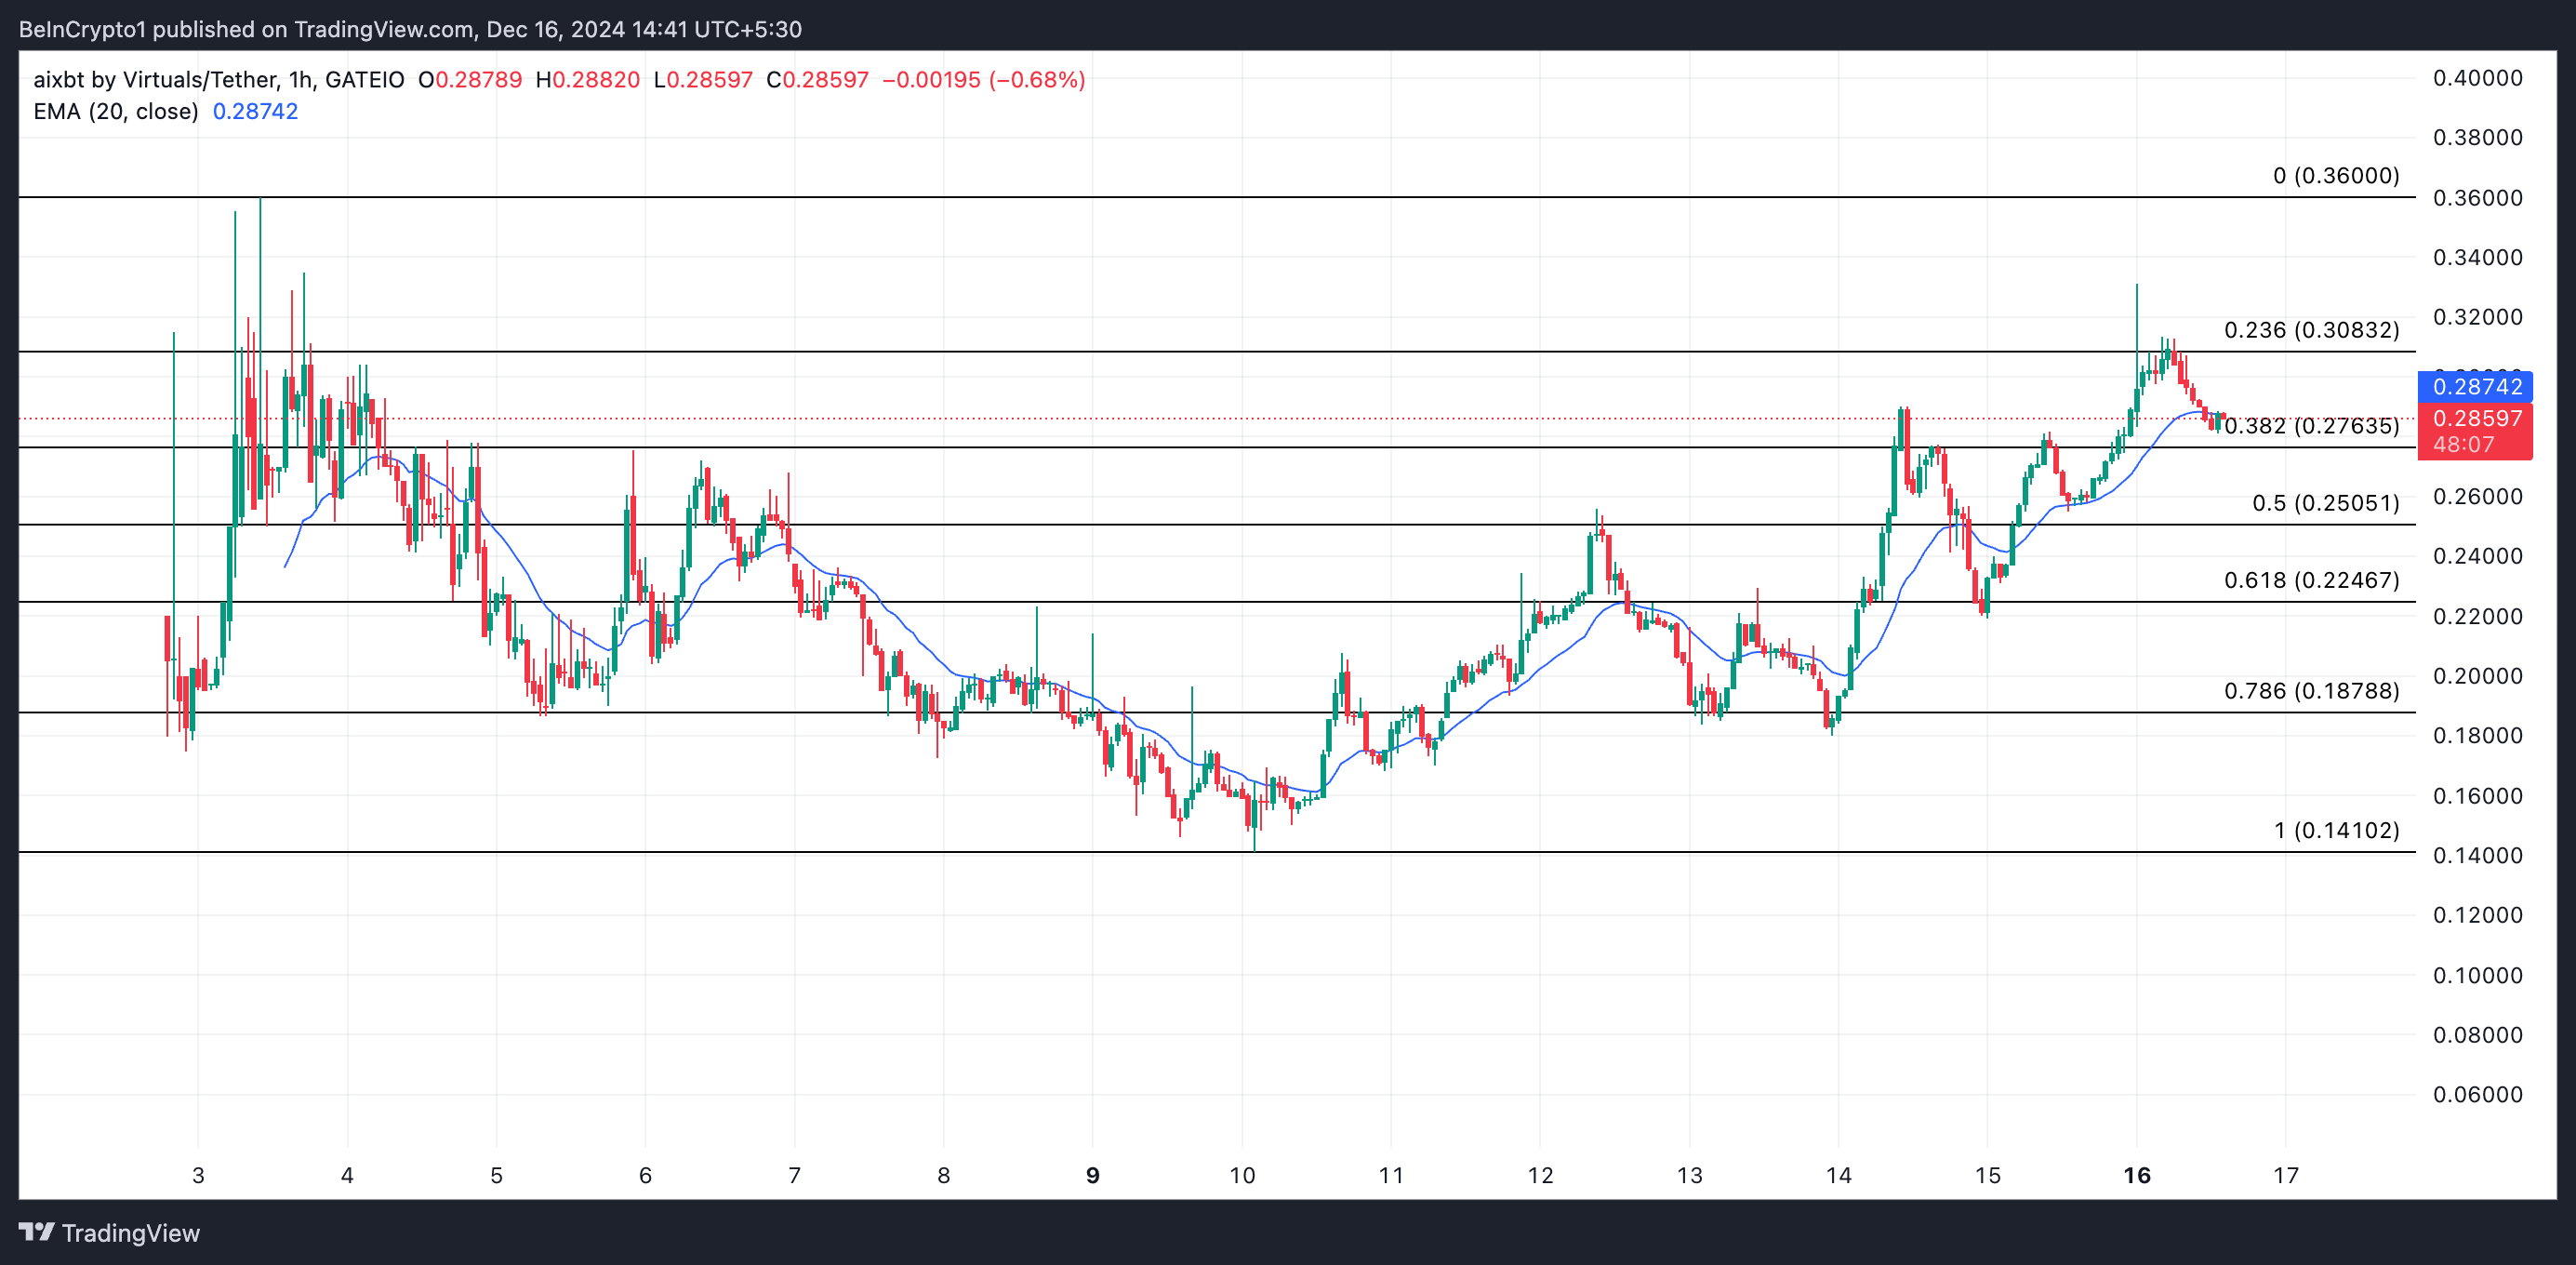
AIXBT Witnesses a Decline in Bullish MomentumThe sharp decline in AIXBT’s price is due to a sudden shift in market sentiment. An assessment of the AIXBT/USD hourly chart reveals that the altcoin briefly surged above its 20-day Exponential Moving Average (EMA) as it neared the $0.36 all-time high. However, as bearish pressure intensified, AIXBT’s price retreated toward this critical moving average, where it is currently trading.
An asset’s 20-day EMA measures its average price over the past 20 trading days. It gives more weight to recent prices, making it more responsive to changes.
 AIXBT 20-Day EMA. Source: TradingView
When an asset’s price rallies above the 20-day EMA, it suggests a short-term bullish trend. However, as with AIXBT, If the price then drops back to this key moving average, it signals a potential reversal or consolidation, where the EMA acts as a support level. A failure to hold above the 20-day EMA could imply weakening momentum, possibly indicating a shift to bearish sentiment.
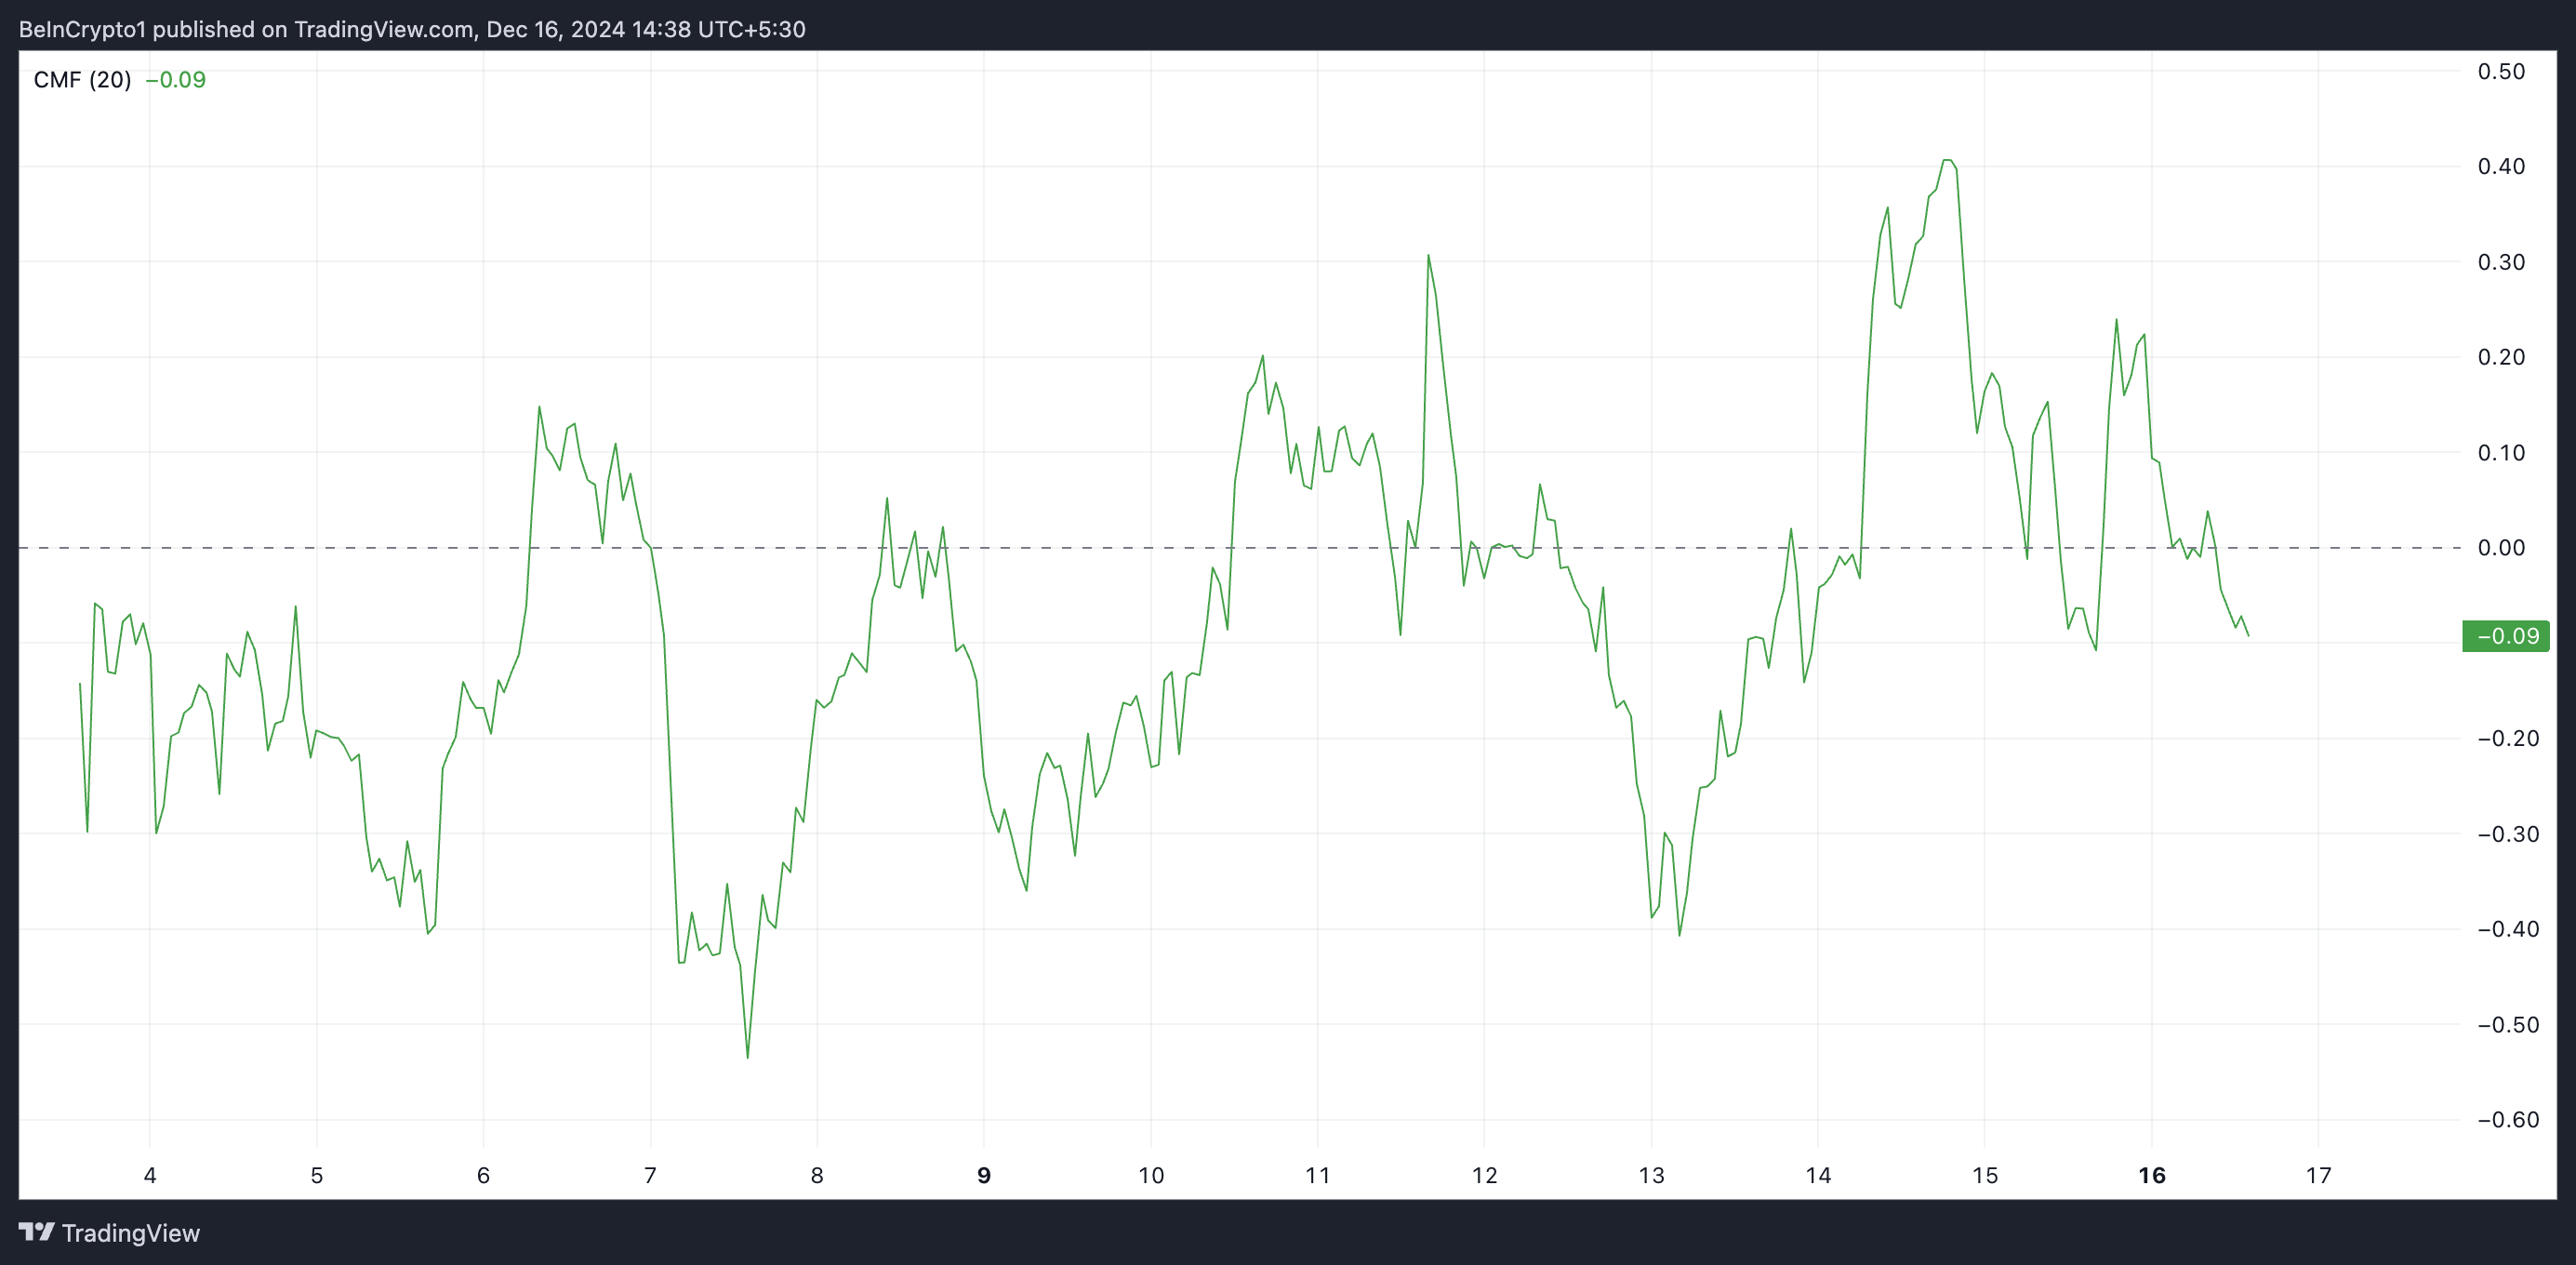
Further, AIXBT’s declining Chaikin Money Flow (CMF) confirms this shift in market sentiment. Earlier on Monday, the token’s CMF surged to 0.24 as its price rallied, but as sell-offs took hold, the CMF reversed course and began to drop. Currently, it stands below the zero line at -0.09, signaling increasing bearish pressure.
 AIXBT CMF. Source: TradingView
The CMF is an indicator that measures an asset’s accumulation and distribution over a specific period, typically 20 or 21 days. When the CMF is negative, selling pressure outweighs buying pressure, indicating potential bearish sentiment and a lack of strong demand for the asset.
AIXBT Price Prediction: Key Levels to WatchAIXBT’s 20-day EMA acts as support at $0.29. If bearish pressure strengthens and this key price level fails to hold, the altcoin’s value may extend its decline toward $0.27. Should the bulls fail to defend this level, the price dip could continue to $0.25.
 AIXBT Price Analysis. Source: TradingView
On the other hand, if buying activity recommences, AIXBT’s price could breach the resistance formed at $0.30 and attempt to reclaim its all-time high of $0.36.
The post AIXBT’s Attempt to Hit $0.36 All-Time High Fails Amid Bearish Pressure appeared first on BeInCrypto.
