BCH Price Surges Past $500: Eyes $541 and New 52W High

The post BCH Price Surges Past $500: Eyes $541 and New 52W High appeared first on Coinpedia Fintech News
As Bitcoin price creates a new all-time high at $97,900, the close curse in Bitcoin Cash is making waves. With a massive surge of 18.29% in the past 24 hours, the BCH price has crossed the $500 barrier.
Will this breakout rally result in a new 52-week high above the $719? Let’s find out in Coinpedia’s latest BCH price analysis.
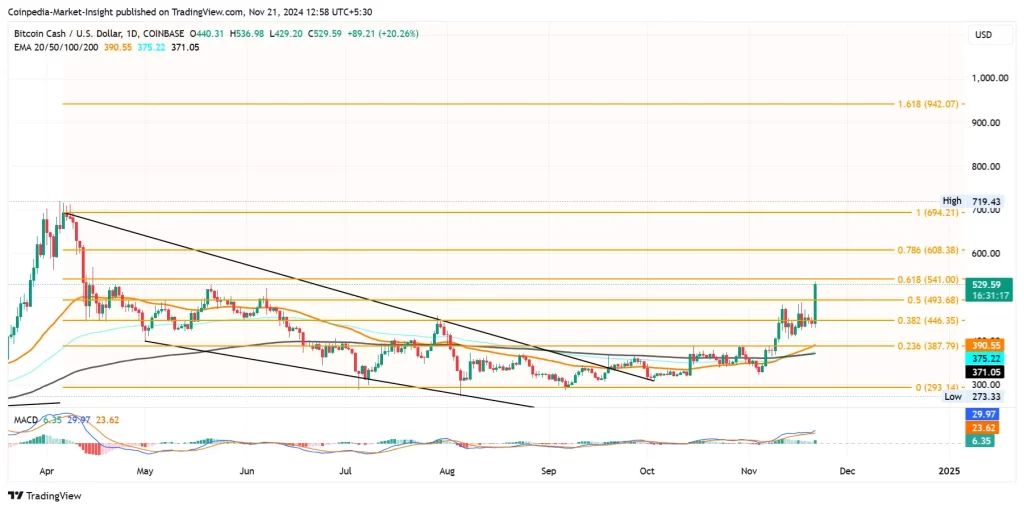
Bitcoin Cash Price PerformanceIn the daily chart, the BCH price action shows a falling-edge breakout rally finally gaining momentum. After consolidation in October and early November, the BCH price has crossed above the 23.60% Fibonacci level at $387.

With a V-shaped recovery, the uptrend starting from… $321 is now trading at $519. This rally accounts for a 61.30% rise. Furthermore, it has broken above the 50% Fibonacci level at $493.
Creating a massive bullish engulfing candle, it has crossed above 2 Fibonacci resistance levels, increasing chances of an upside rally.
Technical indicators:
EMA: Supporting the bullish trend, the recovery rally resulting in a bullish influence has given a golden crossover between 50-day and 200-day EMA. Furthermore, the 100-day EMA and 200-day EMA have given a positive crossover.
MACD: The MACD indicator reveals a narrow escape from a bearish crossover with the bullish engulfing candle. Hence, the technical indicators maintain a positive alignment. Hence, the technical indicators maintain an optimistic viewpoint for BCH price.
Will The BCH Price Cross $700?The Fibonacci retracement tool paints the immediate price target at $541. A breakout above this level will target the $608 and $694 with increased chances of a new 52-week high.
Beyond the 52-week high, the 1.27 Fibonacci level at $803 is a potential price target for December 2024. On the flip side, the crucial support levels for BCH price are at $493 and $446.
As the bull run picks up, will the Bitcoin Cash price reach $1,000 in this recovering market? Find out more about our BCH price prediction, which provides a long-term view.
FAQs What is the current Bitcoin Cash price and recent performance?Bitcoin Cash (BCH) is trading at $519, up 18.29% in the past 24 hours, with a 61.30% rally from $321.
What are BCH’s key price targets?Immediate targets are $541, $608, and $694, with a potential new 52-week high above $719. Longer-term, $803 is a target for December 2024.
What supports BCH’s bullish momentum?A falling-edge breakout, Fibonacci retracement levels, EMA golden crossovers, and bullish MACD alignment support the uptrend.
