Bitcoin (BTC) Trading on Coinbase Sees Decline as Price Fights to Reclaim $60,000
Bitcoin’s (BTC) price troubles have reduced trading activity on the leading cryptocurrency exchange, Coinbase.
This is measured by the coin’s Coinbase Premium Index (CPI), which has dipped into negative territory.
American Investors Reduce Their ExposureOn-chain data show that Bitcoin’s Coinbase Premium Index is -0.003 at press time. This metric measures the difference between BTC’s prices on Coinbase and Binance.
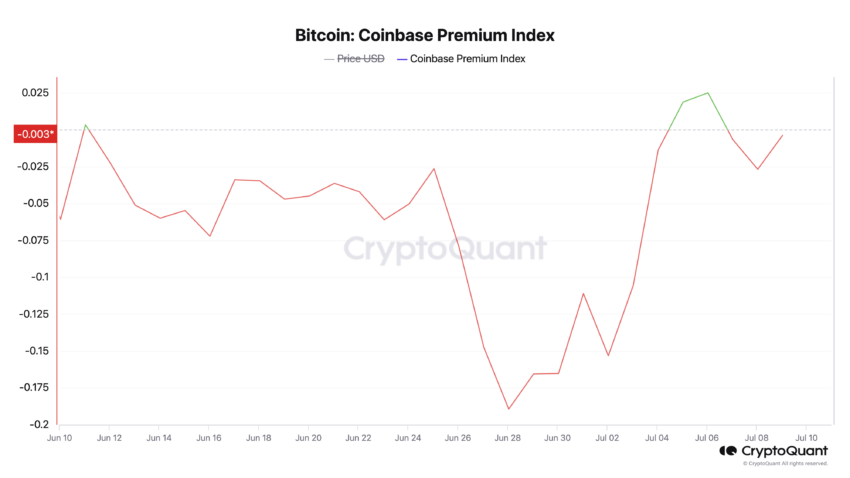 Bitcoin Coinbase Premium Index. Source: CryptoQuant
When its value grows, it suggests significant buying activity by US-based investors on Coinbase. Conversely, when it declines and dips into the negative territory, it signals less trading activity on the US-based exchange.
Confirming this, the coin’s Coinbase Premium Gap (CPG) trends similarly. As of this writing, BTC’s CPG is -2.1%. When BTC’s CPG is negative, it indicates a decline in buying pressure from US-based investors on the exchange.
In a recent interview with BeinCrypto, Julio Moreno, the Head of Research at CryptoQuant, confirmed low BTC trading activity amongst US-based investors. According to Moreno
“US investor demand for Bitcoin has entered negative territory as measured by our Inter-exchange Flow Pulse (IFP) indicator. US investor demand growth is associated with higher Bitcoin prices.”
This metric measures the movement of BTCs between spot and derivative exchanges to gauge investor sentiment and potential future price trends.
When it rises, it is a bullish signal. It suggests that more coins are flowing from spot exchanges to derivative exchanges. It means that BTC holders are becoming more risk-tolerant and potentially positioning themselves for price increases through leverage.
On the other hand, when the coin’s IFP falls, it is a bearish signal that shows the flow of coins out of derivative exchanges and back to spot exchanges. It means that investors are selling their holdings or withdrawing from leveraged positions.
Read more: Who Owns the Most Bitcoin in 2024?
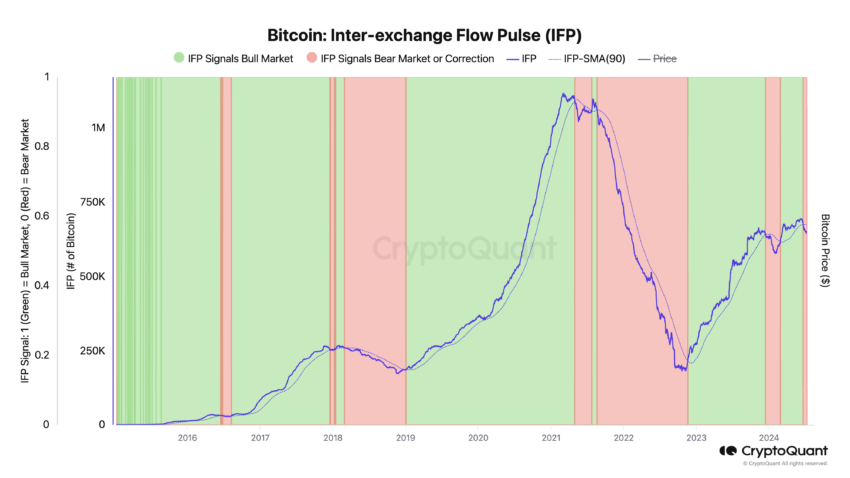 Bitcoin Inter-exchange Flow Pulse. Source: CryptoQuant
As of this writing, BTC’s IFP is declining at 649,500, and its price is currently below the 90-day average. A similar trend occurred between December 14, 2023, and February 24, 2024, after which the coin’s price corrected from $46,000 to a low of $39,000.
BTC Price Prediction: Is the Next Price Level Under $58,000?At press time, BTC trades at $58,633. Still trailed by significant bearish sentiments, the leading coin risks falling below the $58,000 price level again.
According to readings from the coin’s Parabolic Stop and Reverse (SAR), the indicator’s dots lie above BTC’s price, and they have been so positioned since July 4.
This indicator measures an asset’s price trends and potential reversal points. When its dots lie above an asset’s price, the market is said to be in a decline. It indicates that the asset’s price has been falling and may continue to do so.
If the decline continues, BTC’s price may drop to $57,983.
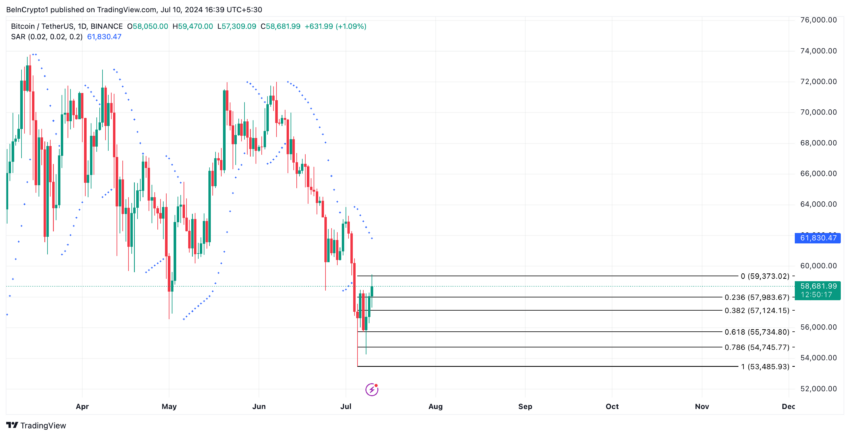 Bitcoin Analysis. Source: TradingView
However, if buying activity surges, the coin’s price may rally to $59,737.
The post Bitcoin (BTC) Trading on Coinbase Sees Decline as Price Fights to Reclaim $60,000 appeared first on BeInCrypto.