DYDX Price Downfall Intensifies: Will Buyers Find The Bottom At $0.72?
The post DYDX Price Downfall Intensifies: Will Buyers Find The Bottom At $0.72? appeared first on Coinpedia Fintech News
Amidst the increasing broader market volatility, altcoins maintain a polarizing approach. While some ride the bullish highway, altcoins like DYDX have witnessed a massive price drop over the weeks. As the downtrend continues, the following support levels are potential buying spots to capture the bottom.
Another Bearish Pennant in DYDXIn the daily chart, the massive downfall in the DYDX price trend is clear, with a 78% fall from $4.37 to $0.92. However, in the recent bullish cycle, the altcoin reclaims the $1 psychological mark, aligning with the broader market recovery.
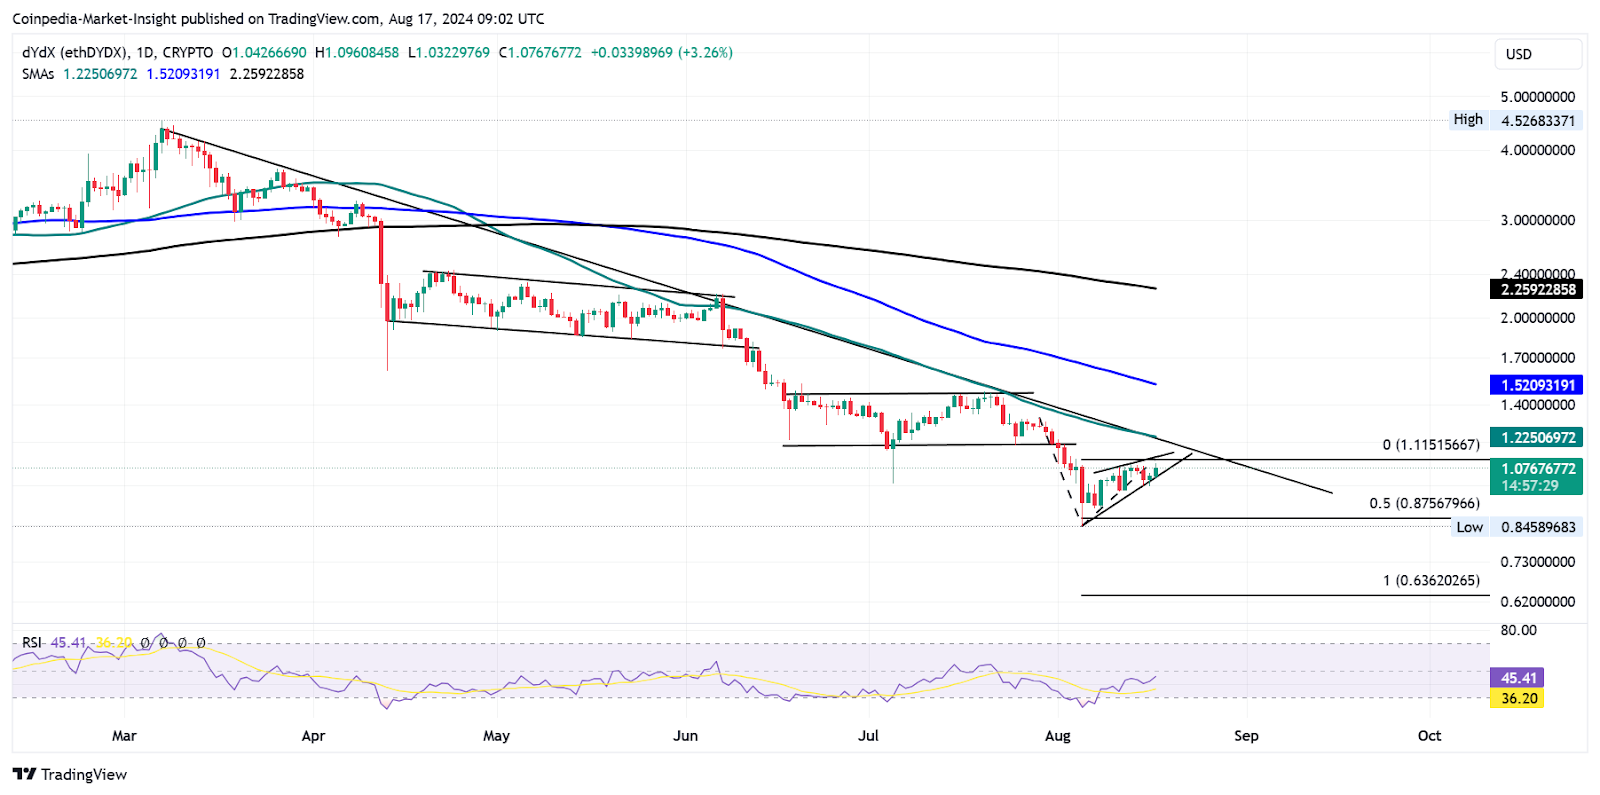
In the daily chart, the bearish trend leads to the formation of a resistance trendline, undermining multiple bullish attempts of trend reversal. DYDX shows a falling channel and consolidation range breakdown during the falling price trend.
Currently, the DYDX price trades at $1.07 with an intraday gain of 3.18% and tests the short-term resistance trendline. However, the recovery run in the DEX token forms a rising wedge, limiting the chances of uptrend continuation.
Technical Indicators:
RSI: The daily RSI line shows a minor recovery run starting from the oversold region and surpassing the 30% boundary. As it heads to the halfway line, the recovery run seems a minor relief in the downtrend.
EMA: The downtrend in the DYDX price results in a bearish alignment of the 50D, 100D, and 200D SMA. Further, the 50D SMA provides dynamic resistance.
Where Is DYDX Price Headed?Based on the Elliot waves, the first phase of the 5-stage correction and an ABC pullback is complete. Currently, the second phase of the 5-stage correction rally is in the fourth cycle.
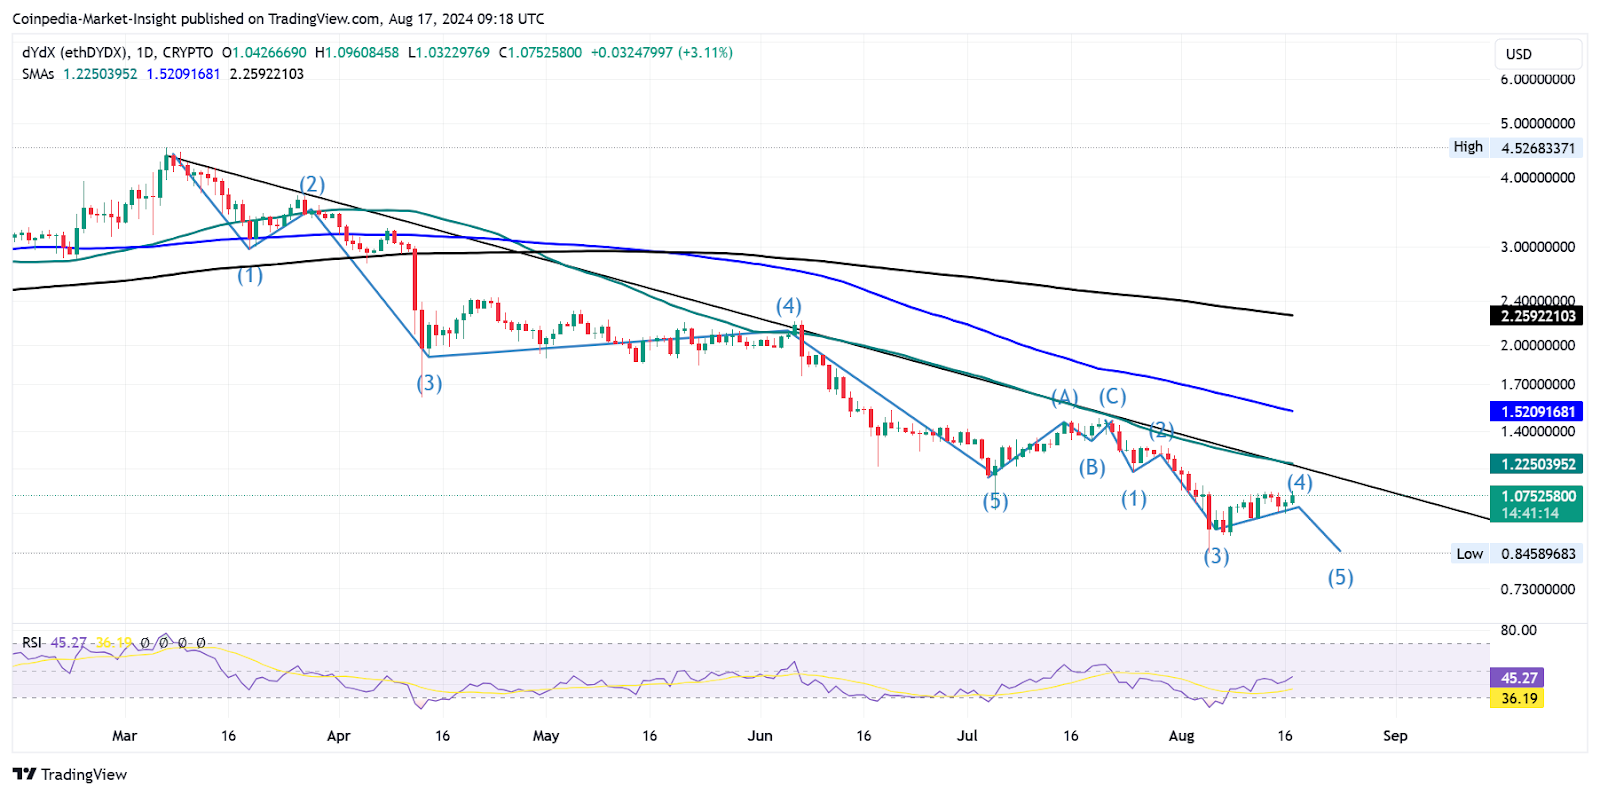
Hence, the chances of another downfall for the DEX token are high. The next support levels are $0.91, $0.84, and $0.72. With the end of the fifth cycle, a bullish breakout of the overhead trendline will be a buying opportunity for a long-term uptrend.