Ethereum’s grip on DeFi challenged by Tron’s stablecoin surge
Stablecoins are a foundational part of the crypto market. Tracking their distribution across blockchains is essential for understanding the underlying trends in DeFi, as they represent the market’s liquidity.
The total value locked (TVL) across all DeFi protocols currently stands at $107.427 billion. This TVL represents the dollar value of all the assets locked in DeFi protocols, showing just how much of the market is invested in this sector. Ethereum’s dominance over this value is evident in its share of the TVL—61.01%. Ethereum’s chokehold on this sector is further seen in the share of TVL Tron, the second-ranked blockchain, which has—just 7.76%.
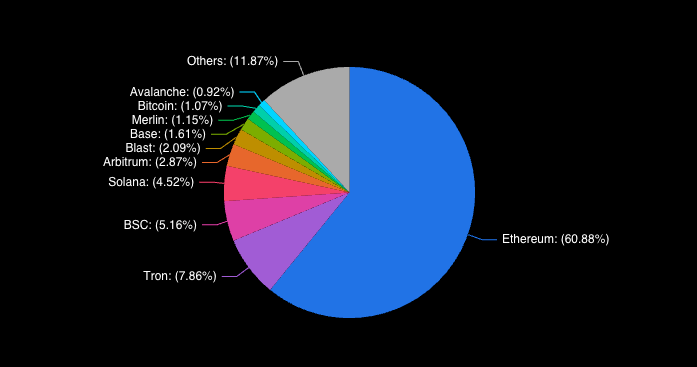 Chart showing the distribution of TVL across blockchains on May 29. 2024 (Source: DeFi Llama)
Looking at TVL fails to paint a clear picture of liquidity trends in DeFi. While Ethereum’s share of TVL shows the value of all tokens locked in the protocol, we need to look at the distribution of stablecoins to understand where most of the liquidity lies.
The market capitalization of all stablecoins currently stands at $160.407 billion, with Tether’s USDT holding a dominant 69.56% share of that market cap.
When looking at the distribution of the total stablecoin market cap across blockchains, Ethereum still comes up as a winner, holding 49.87% of the stablecoin market cap, amounting to $79.947 billion. However, Tron follows closely with 35.52% of the stablecoin market cap, amounting to $56.929 billion. BSC, Arbitrum, Base, and Solana hold significantly smaller shares at 3.21%, 2.45%, 1.97%, and 1.92%, respectively.
Blockchain Market Cap Share (%) Total Market Cap ($) Ethereum 49.87 $79.947b Tron 35.52 $56.929b BSC 3.21 $5.141b Arbitrum 2.45 $3.923b Base 1.97 $3.156b Solana 1.92 $3.085bExamining the distribution of stablecoins within these chains provides further insights. On Ethereum, USDT leads with $44.517 billion, followed by USDC at $21.688 billion, DAI at $4.746 billion, USDe at $2.905 billion, and FDUSD at $2.447 billion. Tron’s stablecoin market cap is predominantly USDT at $55.981 billion, with smaller contributions from USDD, USDC, TUSD, and USDJ.
To better understand the difference in liquidity across blockchain, it’s important to differentiate between the market cap of stablecoins issued directly on each chain and those bridged from other chains. On Ethereum, $89.375 billion worth of stablecoins are issued on-chain, whereas only $15.04 million are bridged. Tron’s stablecoin issuance stands at $59.101 billion, with no bridged stablecoins, showing its reliance on native stablecoin issuance.
On the other hand, BSC shows a different pattern, with $574.51 million issued on-chain and a significant $4.577 billion bridged. Arbitrum has $1.165 billion issued and $2.762 billion bridged, showing substantial cross-chain activity on the platform. Base and Solana show much lower bridging activity, with Base having $3 billion issued and $155.72 million bridged and Solana showing $3.083 billion issued and $7.04 million bridged.
Blockchain Total Stablecoin Market Cap Issued on Chain ($) Total Stablecoin Market Cap Bridged to Chain ($) Ethereum $89.375b $15.04m Tron $59.101b $0 BSC $574.51m $4.577b Arbitrum $1.165b $2.762b Base $3b $155.72m Solana $3.083b $7.04mA higher bridged stablecoin market cap suggests increased interchain activity, indicating that users and liquidity are moving across different blockchains. This trend shows the growing importance of interoperability in the DeFi space, where liquidity and assets flow across multiple chains, enhancing the overall flexibility and efficiency of the ecosystem. BSC’s and Arbitrum’s considerable bridged stablecoin market caps ($4.577 billion and $2.762 billion, respectively) indicate that these chains are becoming important venues for DeFi activities. Their ability to attract bridged assets suggests they offer competitive advantages, such as lower fees or faster transactions, that appeal to DeFi users.
Despite holding the largest share of TVL in DeFi protocols, Ethereum’s dominant position is gradually waning as other blockchains like Tron gain ground. Tron’s substantial stablecoin market cap and negligible bridging activity suggest a strong preference for using this blockchain for stablecoin transactions, potentially due to its lower transaction fees and faster processing times than Ethereum. Meanwhile, the rising stablecoin market caps on chains like Arbitrum and BSC and significant bridging show the market engaged in more diverse DeFi activities across multiple platforms.
The differences in stablecoin issuance and bridging across chains suggest a fragmentation and specialization within the DeFi market. This shows that certain chains are becoming specialized hubs for specific types of DeFi activities, such as lending, borrowing, or liquidity provision, based on their characteristics and user base.
The post Ethereum’s grip on DeFi challenged by Tron’s stablecoin surge appeared first on CryptoSlate.