Ethereum (ETH) Breaks Key Moving Average, Bears Seize Momentum
Ethereum’s (ETH) price briefly traded above its 20-day Exponential Moving Average (EMA) during the trading session on May 15, suggesting a momentary decline in selling pressure.
However, as the bullish pressure lost momentum, the bears initiated a downtrend, causing the altcoin’s price to trade below this key moving average at press time.
Ethereum Bulls Are Yet To Give UpWhen an asset trades above its 20-day EMA, it is regarded as a bullish signal because it means its current price has surged past its average price of the past 20 days. Market participants interpret it as a shift toward coin accumulation.
ETH’s brief stint above the 20-day EMA suggested that the bulls regained market control momentarily before losing it to the bears. Despite this, bullish sentiments abound in the market.
At the time of writing, the coin’s weighted sentiment is 0.32. This metric measures the social sentiment surrounding an asset. When its value is positive like this, it indicates that the asset has a generally bullish outlook on social media.
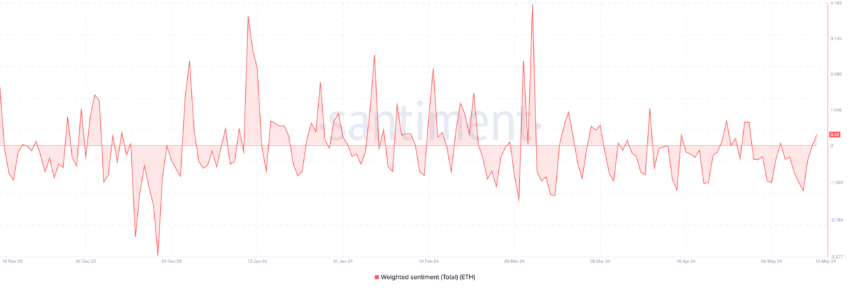 Ethereum Weighted Sentiment. Source: Santiment
Further, readings from the coin’s Elder-Ray Index show that it returns a positive value at the time of writing. This indicator measures the relationship between the strength of ETH’s buyers and sellers in the market.
When its value is positive, bull power dominates the market. As of this writing, ETH’s Elder-Ray Index was 46.46.
Read More: How to Invest in Ethereum ETFs?
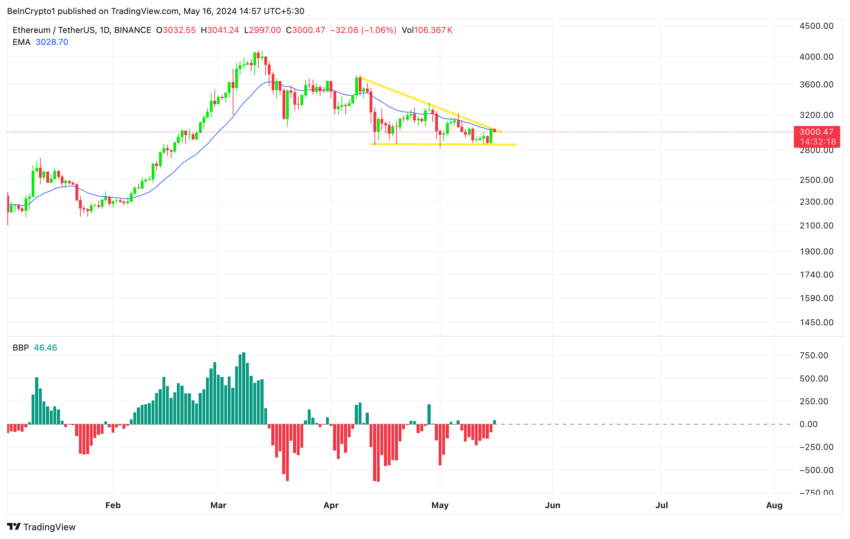 Ethereum Price Analysis. Source: Tradingview
ETH Price Prediction: The Bears Will Not Let Up Easily
Ethereum Price Analysis. Source: Tradingview
ETH Price Prediction: The Bears Will Not Let Up Easily
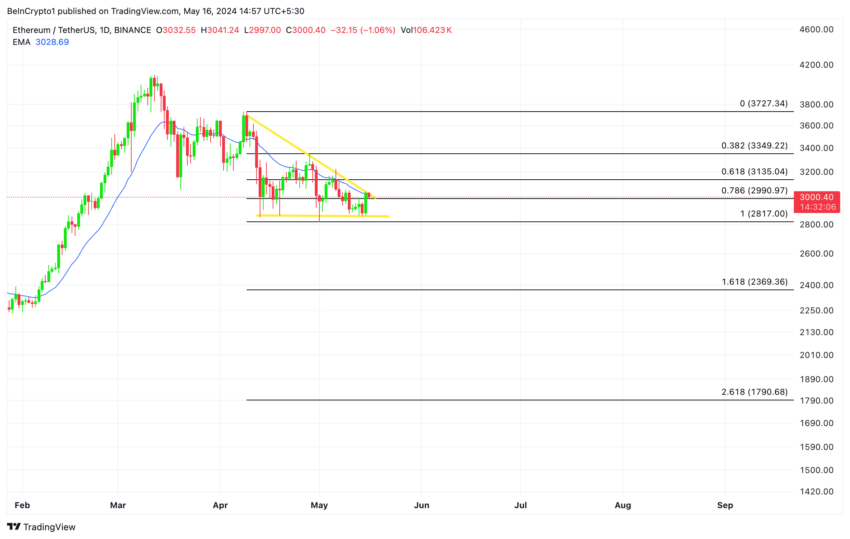
Although the metrics assessed above suggested the presence of bullish activity in the ETH market, it is trite to note that its price assessed on a daily chart remains within a descending triangle. This is generally seen as a bearish signal.
A descending triangle is formed when an asset’s price makes a series of lower highs. When this happens, a certain price level forms support. In ETH’s case, this is the $2,864 price point.
If bearish pressure mounts and the coin erases its recent gains, it may experience a price drawdown under $3,000 to trade at the $2,800 price region.
Read More: Ethereum (ETH) Price Prediction 2024/2025/2030
 Ethereum Price Analysis. Source: Tradingview
However, if this projection is invalidated and the coin breaks above the upper trend line of this triangle, it may exchange hands above $3,100 in the short term.
The post Ethereum (ETH) Breaks Key Moving Average, Bears Seize Momentum appeared first on BeInCrypto.