Optimism (OP) Price Support and Resistance: Key Levels in Focus
In this analysis, you will delve into the recent price drop of the Optimism token, focusing on the 4-hour chart.
Additionally, you will explore the trends in daily unique addresses and transaction volumes to assess the network’s health and potential impact on the token’s value.
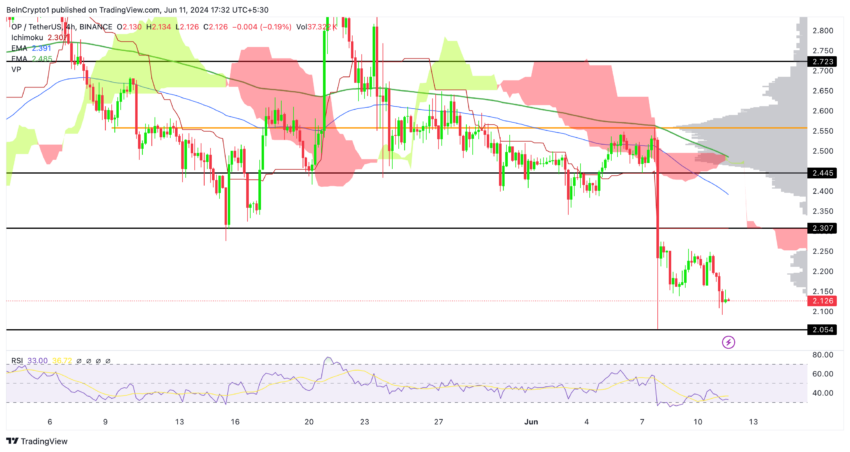
Optimism: A Technical OverviewExamining the 4-hour chart of the Optimism token, we see that on June 7, the price broke below the Ichimoku Cloud, resulting in an 18% drop in that breakout candle.
This significant movement underscores the importance of monitoring technical indicators for effective risk management, such as setting stop losses. Following this sharp decline, the price stabilized within the range of $2.140 to $2.240.
 Optimism Price Action (4H). Source: TradingView
After the drop, the price stabilized within the $2.140 to $2.240 range. Additionally, the volume profile indicates a low-volume price range within this consolidation period, suggesting limited trading activity and potential for future volatility.
Read More: Optimism vs. Arbitrum: Ethereum Layer-2 Rollups Compared
The black lines marking resistance and support levels are crucial Ichimoku baseline plateaus that traders should closely monitor. These levels can provide insight into potential price action and areas where the price might encounter significant support or resistance.
Resistance Levels ($2.723, $2.445): These price levels are where the price has previously faced selling pressure, making them critical to monitor for potential reversals or breakouts.
Support Level ($$2.054): This price levels highlight areas where buying interest has historically emerged, potentially acting as a price floor.
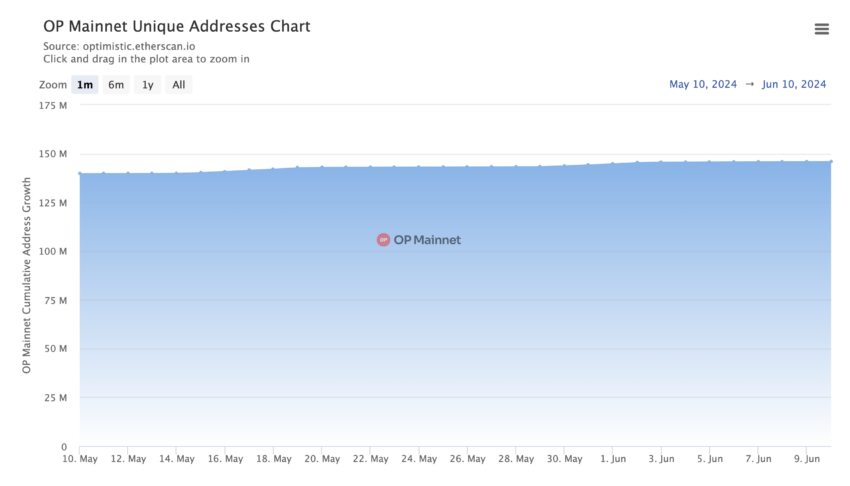
Daily AddressesFrom May 1, 2024, to June 10, 2024, the number of unique addresses on the OP Mainnet increased from 138,107,252 to 145,937,135, a total increase of 7,829,883 addresses.
The largest single-day increase was on May 18, 2024, with an addition of 642,066 unique addresses.
 Optimism Mainnet Daily Unique Addresses. Source: EtherScan
There is a consistent daily increase in unique addresses, indicating sustained user interest and adoption of the OP Mainnet.
The steady rise in daily unique active addresses is a strong network health indicator.
More unique addresses interact with the OP Mainnet, suggesting a growing user base and increased network activity. This growth can lead to higher network value, as user adoption is a critical factor in a token’s success and value.
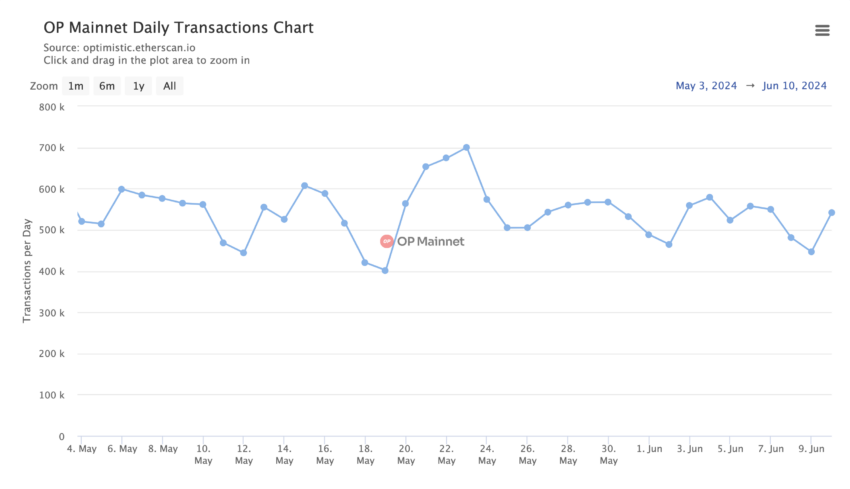
Daily TransactionsThe analysis of daily transactions is crucial for understanding the network’s activity levels. High transaction volumes indicate robust network usage and engagement, which are positive signs of network vitality.
Daily transactions exhibit significant volatility, with substantial changes in the number of transactions from one day to the next.
Read More: What Is Optimism?
 Optimism Mainnet Daily Transactions. Source: EtherScan
Between June 1 and June 10, OP Mainnet saw an increase of 53,778 transactions (from 487,984 to 541,762). This represents a marked improvement in daily activity, reflecting increased user engagement or significant network events driving higher transaction volumes.
The fundamental outlook for Optimism remains bullish. Despite Bitcoin’s price drop to $67,000, the Optimism token has not experienced another sharp decline today and has maintained its range.
A breakout below the $2.05 level could signal a significant continued decline. Well, if the price holds above this level and Bitcoin recovers to $70,000, Optimism could trade back at $2.30 to $2.40 in the mid-term.
The post Optimism (OP) Price Support and Resistance: Key Levels in Focus appeared first on BeInCrypto.