Is Pendle Price Ready for a Breakout Rally? $6.98 Target in Focus?

The post Is Pendle Price Ready for a Breakout Rally? $6.98 Target in Focus? appeared first on Coinpedia Fintech News
With the crypto market starting the week on a recovery note, the altcoins are witnessing a refreshed surge in buying pressure. Among the top performers, Pendle (PENDLE) has hit the $4.5 market price with an 18% jump in the last 30 days.
The buyers anticipate the bull run in Pendle to reach a market cap of $1B with a token market price of $10. So, let’s look at the PENDLE price analysis amid the crypto market recovery to find the bull run chances this November.
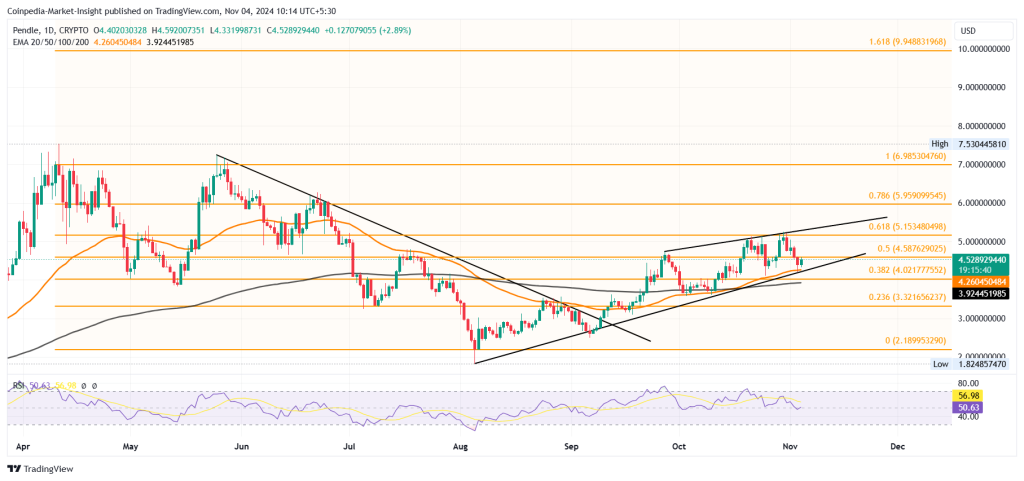
Pendle Price Breaks The TrendlineFollowing the 4-year resistance trendline breakout with a V-shaped reversal, the Pendle token price continues to gain bullish momentum. Compared to the bottom formation at $1.82 during the pullback phase, the Pendle price has increased by 148% to the current market price of $4.52.

The recovery rally forms a local support trendline and has crossed above the 50-day and 200-day EMA. Currently, the Pendle price faces an overhead resistance, highlighting a resistance trendline. This completes a rising wedge pattern in the daily chart.
The Pendle price action within the rising wedge currently teaches a double bottom formation. The double bottom takes a lower price rejection from the 50-day EMA and has a neckline near the $5.15 mark.
Currently, the Pendle price is trading at $4.52 with an intraday gain of 2.84% following the 3.96% drop last night. The intraday recovery teases a tweezer bottom formation to signal a new bullish cycle within the rising wedge pattern.
Technical Indicators:
RSI: The lack of bullish divergence in the daily RSI line limits the possibility of a double-bottom reversal.
EMA: The increased bullish influence has resulted in a golden crossover between the 50-200-day EMA. Furthermore, the 50-day EMA acts as a constant dynamic support to the Pendle price pullbacks.
Will PENDLE Reach $10?A bullish cycle will likely challenge the overhead trendline slightly above the neckline at $5.15. Based on the Fibonacci levels, the bullish breakout of the rising wedge pattern will likely reach the $6.98 mark or the 100% Fibonacci level.
Optimistically, the bullish trend will likely continue to the 1.618 Fibonacci level, with the broader market recovery at $9.94. Hence, with the broader market recovery, the bull run in Pendle is likely to hit the $10 psychological mark.
Also, read our Bitcoin Price Prediction 2024-2030 for an overview of the long-term targets, and subscribe to us for the latest crypto market developments.
FAQs What is the price of Pendle coin today?At press time, PENDLE, the native token of Pendle Finance, a DeFi protocol, is currently trading at $4.52.
Will Pendle Coin Price Cross $5?The Pendle coin price has increased by 2.23% today, and the chances of crossing $5 have significantly increased.
Is Pendle an AI coin?Pendle crypto is a DeFi protocol focusing on the tokenization of future yields and offers its trading along with other DeFi assets using an Automated Market Maker (AMM) system. As it allows users to speculate on or hedge against yield changes, it is mainly a DeFi token and not an AI coin.
