PEPE Price Chart Forms Bull Flag, Could Restore 100% of Holders to Profitability
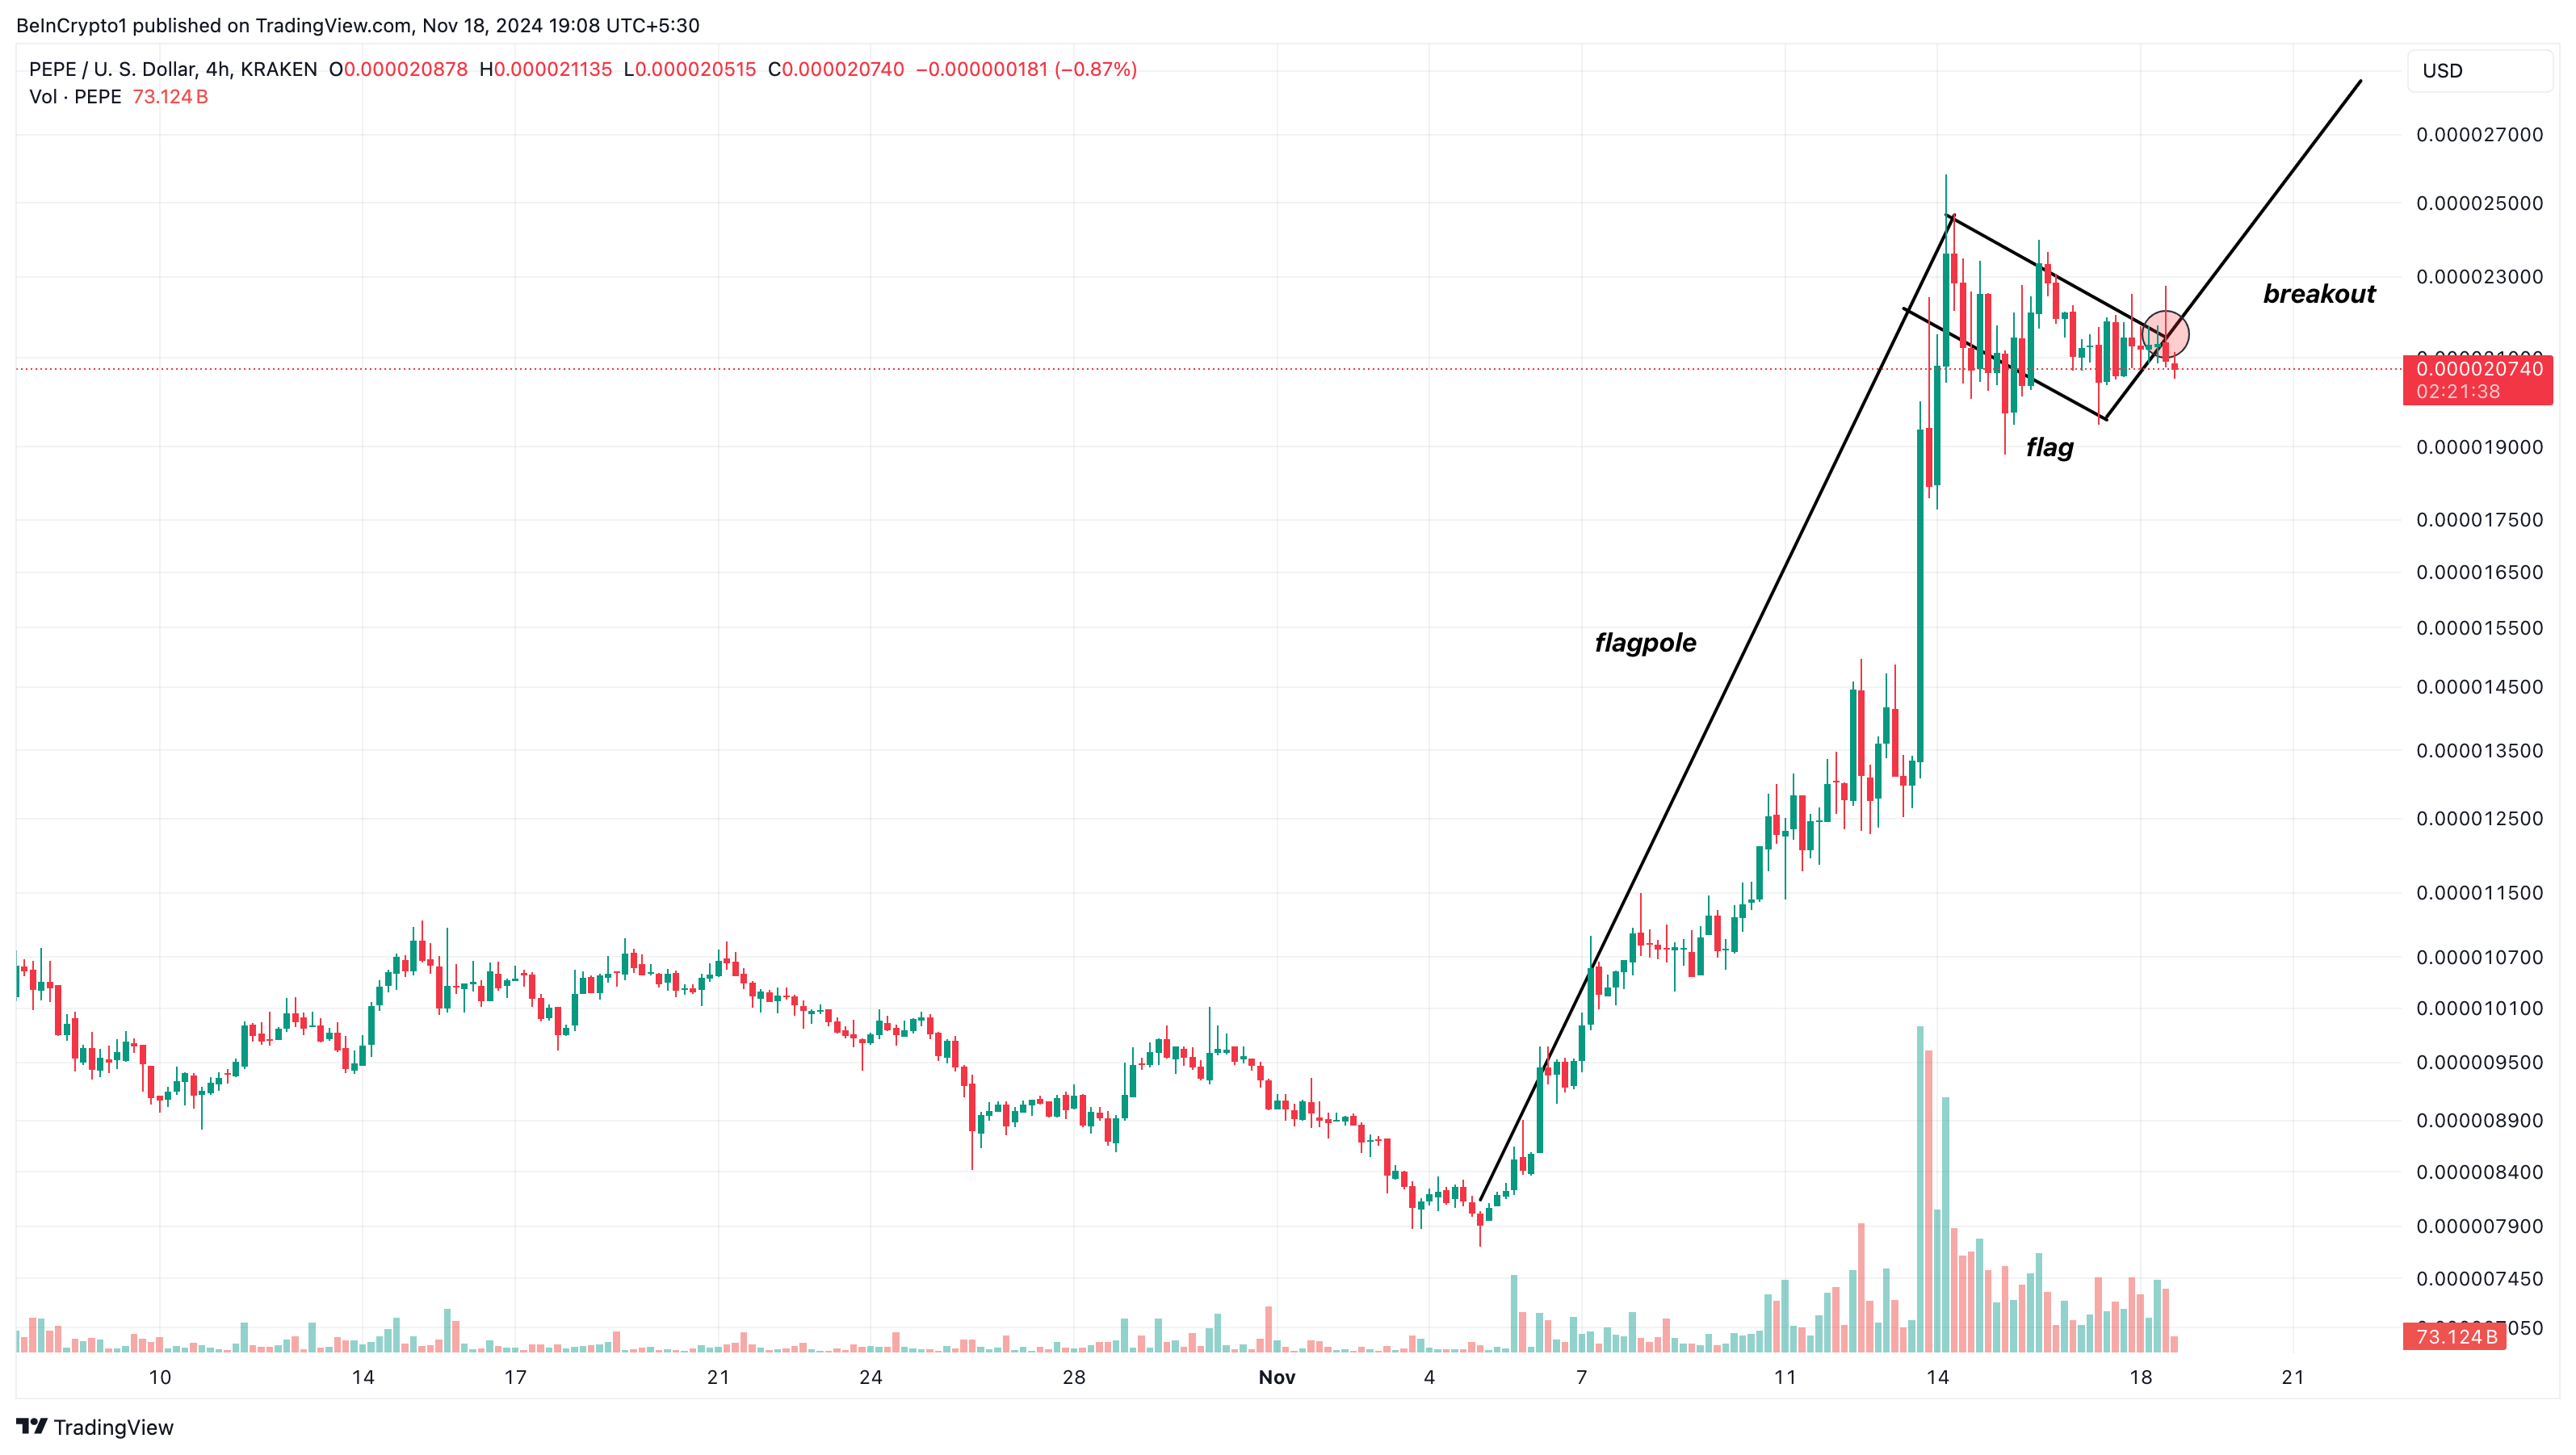
The 4-hour PEPE price chart has formed a bullish pattern, suggesting that the meme coin’s price could be ready to hit a new peak. At press time, PEPE’s price is $0.000021, 17% down from the all-time high it reached on November 14.
As a result, 1% of the token’s holders are in the red zone, while 7% are at the breakeven point. This on-chain analysis reveals how PEPE’s price action could return all these holders to profits.
Pepe Technical Pattern Siginifies RecoveryAnalysis of the 4-hour timeframe shows that the PEPE price chart has formed a bull flag. A bull flag is a continuation pattern indicating that a cryptocurrency’s price is likely to resume its upward trend following a brief consolidation.
The pattern consists of the “flagpole,” which represents the price increase period. It is then followed by the “flag,” indicating the consolidation phase, and the breakout, which occurs after the price rises above the resistance line.
As seen below, PEPE’s price is on the verge of breaking out of the $0.000021 region. Once validated, this bull flag formation could lead to a notable rise above the all-time high of $0.000025.
 Pepe 4-Hour Price Analysis. Source: TradingView
This prediction also aligns with the position of the Global In/Out of Money (GIOM). The Global GIOM indicator groups all wallet addresses into clusters based on the price ranges at which they previously acquired their holdings.
Larger clusters indicate stronger support or resistance levels at those price points, as they represent areas where many investors are positioned. According to IntoTheBlock, only 3,940 addresses hold 2.76 trillion tokens, and accumulated around $0.000023 are out of the money.
Considering the weak resistance and strong support, PEPE’s price might increase. In short, the on-chain indicator suggests that the meme coin’s value might rise as high as $0.000041.
 Pepe Global/In Out of the Money. Source: IntoTheBlock
PEPE Price Prediction: First Target at $0.000032
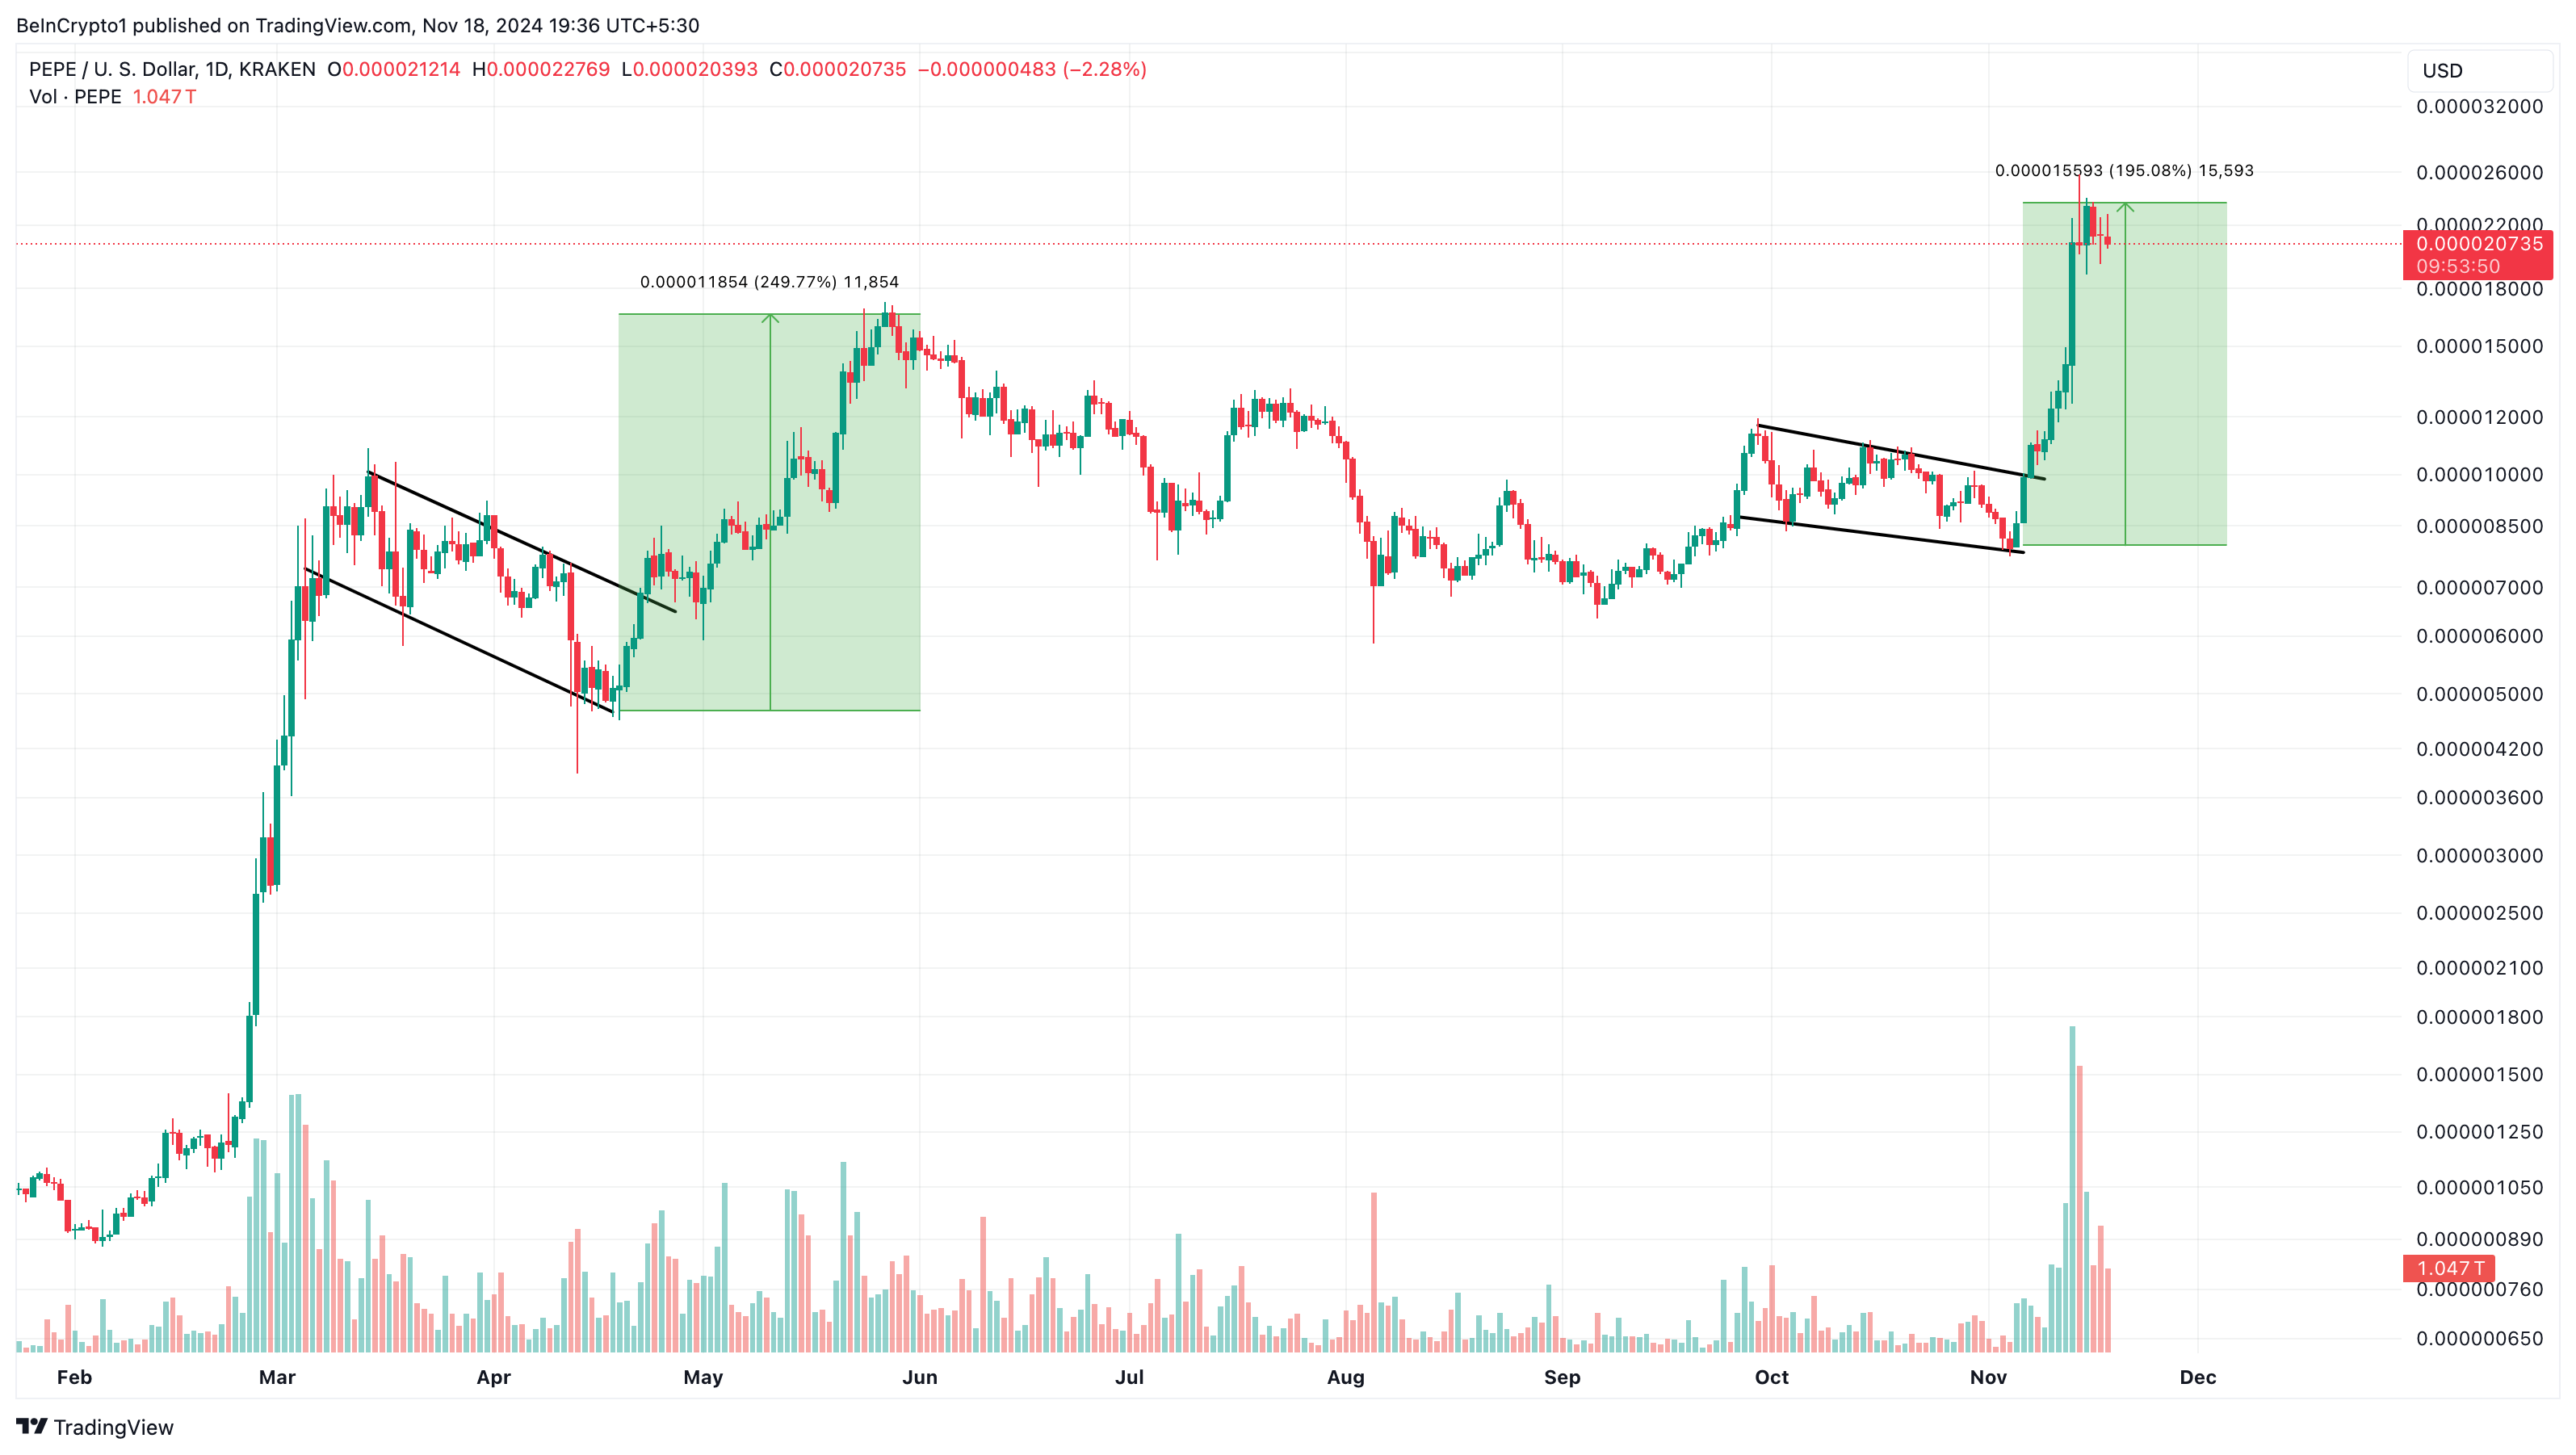
On the daily PEPE price chart, the token seems to have followed a similar movement to its 250% hike around March. At that time, the frog-themed meme coin broke out of a descending channel.
Between September 29 and the first week in November, PEPE traded within a descending channel. While it has since broken out, the image above shows that the meme coin’s value could climb higher.
 Pepe Daily Analysis. Source: TradingView
If this happens, then the value might rise toward 0.000032, possibly hitting $0.000041. On the other hand, if selling pressure rises, this might not happen. Instead, PEPE could decline below $0.000015.
The post PEPE Price Chart Forms Bull Flag, Could Restore 100% of Holders to Profitability appeared first on BeInCrypto.
