Polkadot (DOT) Price Could Reach 2-Year Highs If This Happens
Polkadot (DOT) price has surged over 10% in the last 24 hours and is up an impressive 178.44% in the past 30 days, reflecting strong bullish momentum. However, technical indicators suggest the rally may be losing steam, with RSI and CMF both showing signs of weakening buying pressure.
While DOT’s EMA lines remain bullish, a fading uptrend could lead the price to test supports. On the flip side, a resurgence in momentum could propel DOT toward its next resistance, with a potential breakout at its highest level since April 2022.
DOT RSI Cooled DownDOT RSI currently sits at 62, cooling off after briefly exceeding 70 for the first time since November 24. This recent move above 70 signaled overbought conditions and strong buying momentum, while the retreat to 62 indicates a slight slowdown.
Despite the pullback, the RSI remains in bullish territory, suggesting continued optimism among buyers.
 DOT RSI. Source: TradingView
The RSI (Relative Strength Index) measures the speed and magnitude of price movements, with values above 70 indicating overbought conditions and below 30 signaling oversold levels. At 62, DOT’s RSI reflects healthy momentum, although it is no longer at peak levels.
If the RSI stabilizes or climbs back above 70, Polkadot could see another push higher, but a sustained drop below 60 could indicate waning strength and lead to price consolidation or a minor pullback.
Polkadot CMF Is Still PositiveDOT’s CMF (Chaikin Money Flow) is currently at 0.07, down from a recent peak of 0.22, the highest level since November 23. This decline suggests that while buying pressure remains in play, it has weakened from its earlier intensity.
The positive CMF value still indicates net capital inflow into DOT, reflecting overall bullish sentiment, but the decreasing trend signals a potential slowdown.
 DOT CMF. Source: TradingView
The CMF measures the flow of money into and out of an asset based on price and volume, with values above 0 indicating buying pressure and values below 0 suggesting selling pressure. Although DOT CMF remains positive at 0.07, the decline from 0.22 could signify a reduction in bullish momentum.
If the CMF continues to drop, it might indicate growing selling activity, potentially leading to price consolidation or a pullback, whereas a recovery toward higher levels could reignite upward momentum.
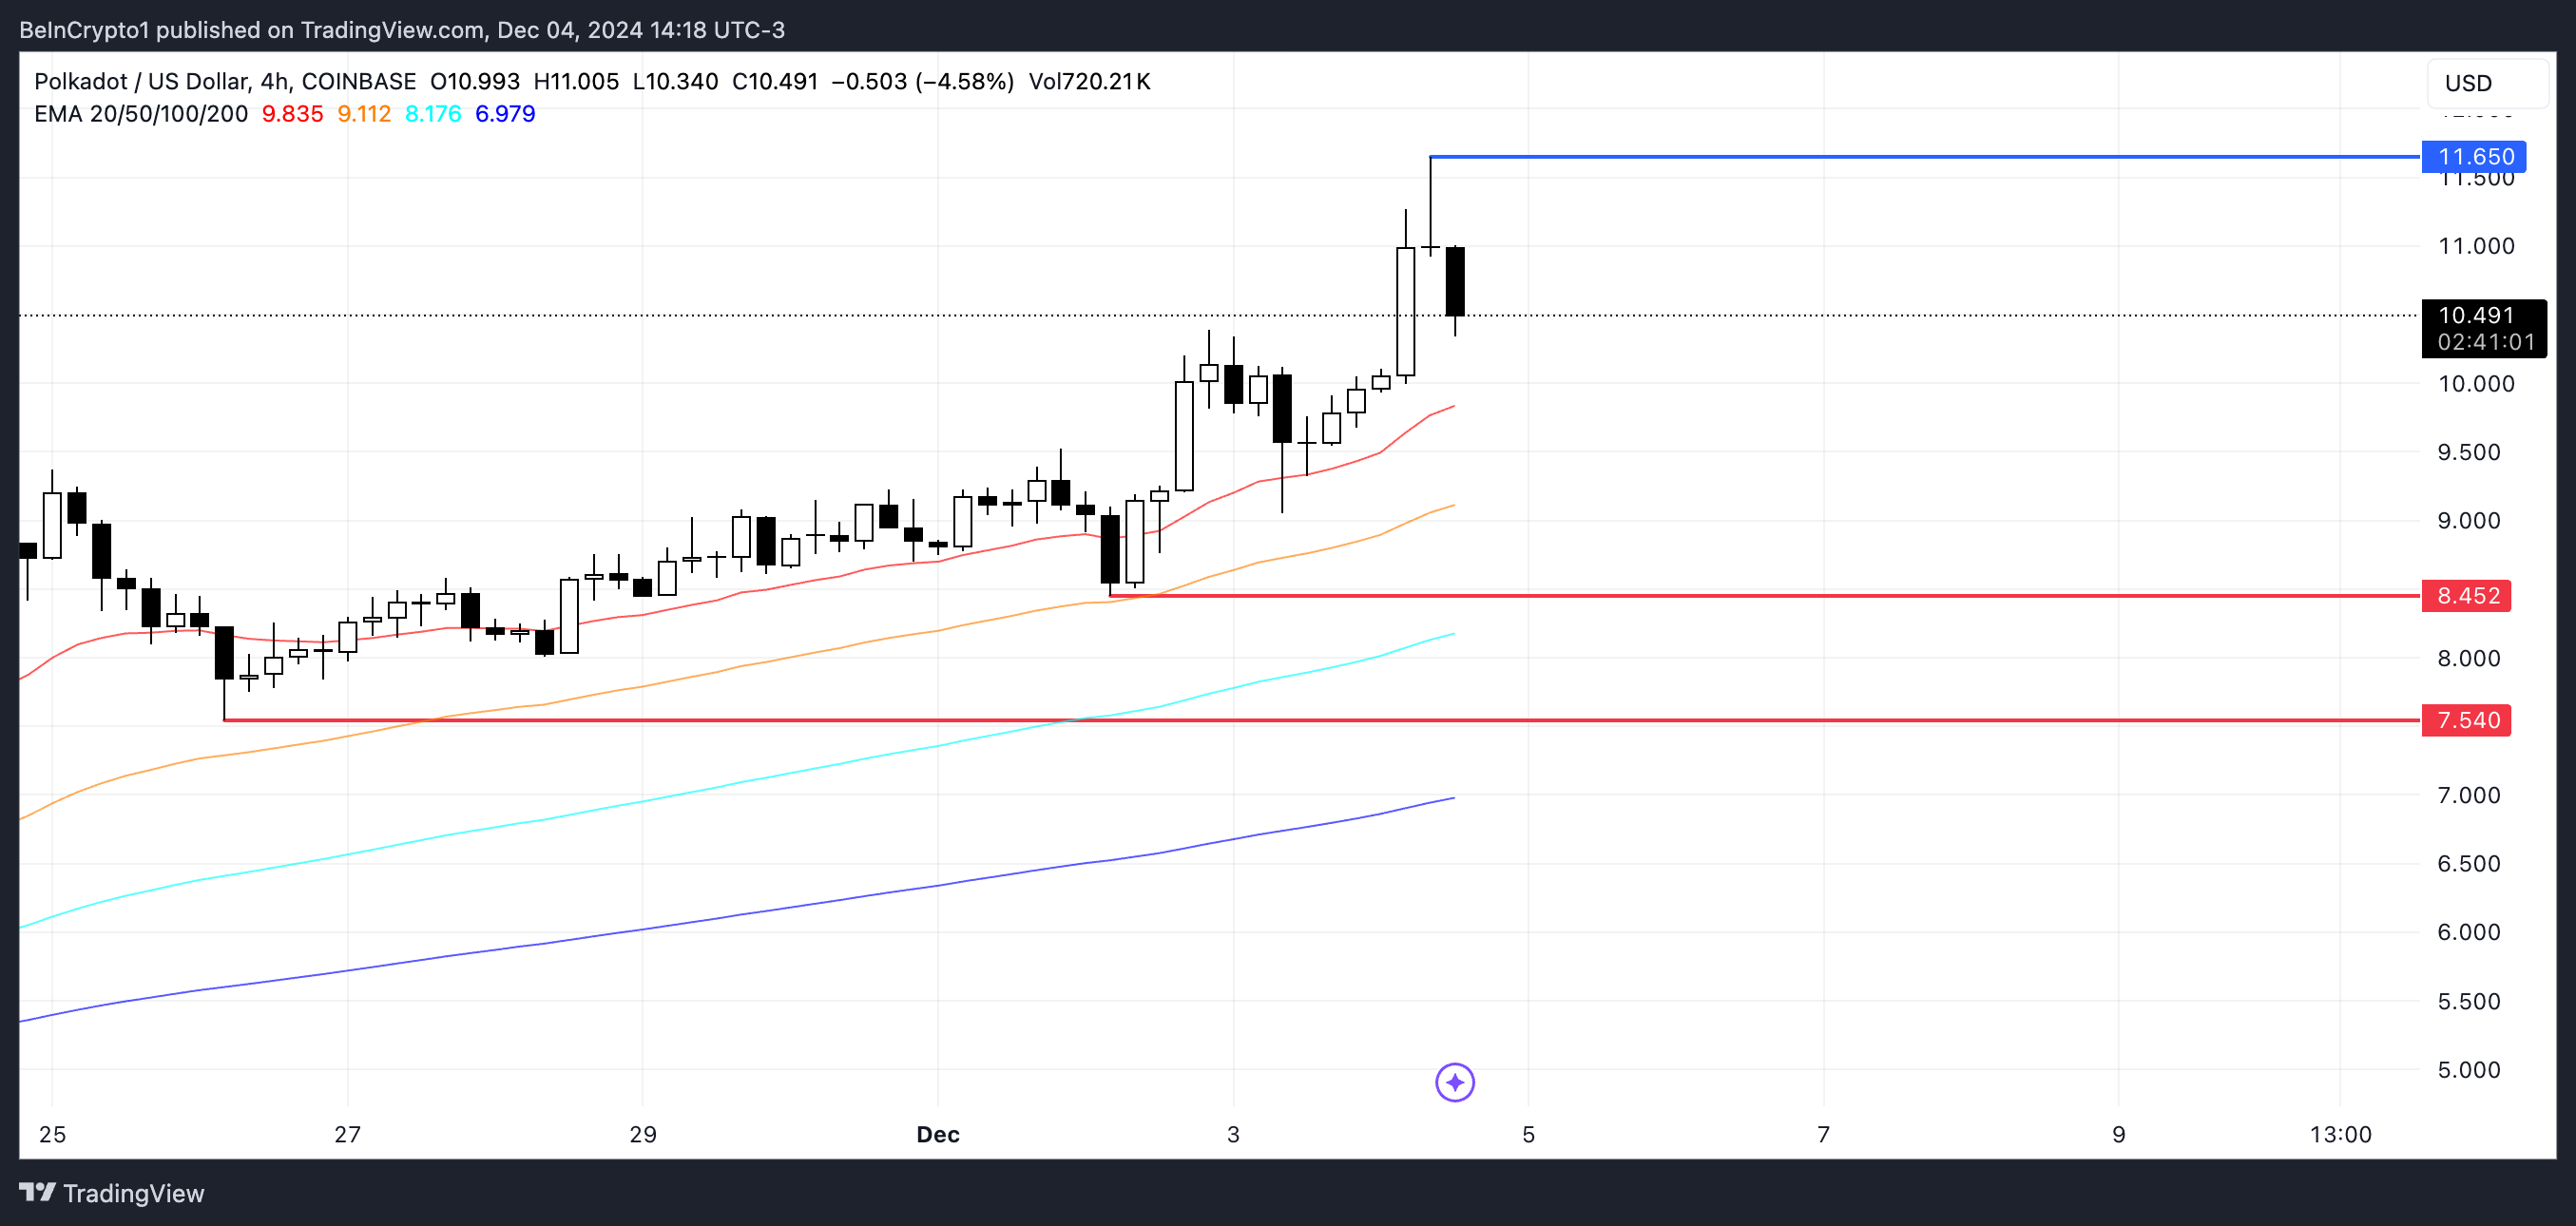
DOT Price Prediction: Can Polkadot Reach $12 In December?DOT EMA lines remain bullish, with short-term lines still above long-term ones, signaling ongoing upward momentum. However, other indicators like RSI and CMF suggest that the current uptrend might be weakening.
 DOT Price Analysis. Source: TradingView
If buying pressure continues to fade, Polkadot price could test the support level at $8.4, with a potential further drop to $7.5 if that support fails.
Conversely, if the uptrend regains strength, DOT price could aim for a key resistance at $11.6. Breaking through this level might push the price toward $12, a milestone not seen since April 2022.
The post Polkadot (DOT) Price Could Reach 2-Year Highs If This Happens appeared first on BeInCrypto.
