Shiba Inu (SHIB) Approaches Critical Support, Bottom Could Be 10% Away
Shiba Inu (SHIB) holders have long hoped for a turnaround in the meme coin’s fortunes. However, the token has dropped 19.33% in value over the last 30 days.
Despite this disappointing performance, on-chain analysis indicates that relief could be just around the corner.
Shiba Inu Finally Nears Its LifelineThe key on-chain metric driving this bias is the Market Value to Realized Value (MVRV) Long/Short Difference. Fundamentally, the MVRV Long/Short Difference shows whether short-term holders are making more profits than their long-term counterparts.
A positive rating means long-term holders have more unrealized gains, while a negative reading favors short-term holders. Additionally, this metric helps identify market bottoms and tops.
Read more: 12 Best Shiba Inu (SHIB) Wallets in 2024
As of now, the metric reads -14.44%. Historically, SHIB’s price tends to bottom out when the MVRV Long/Short Difference reaches -24.05%.
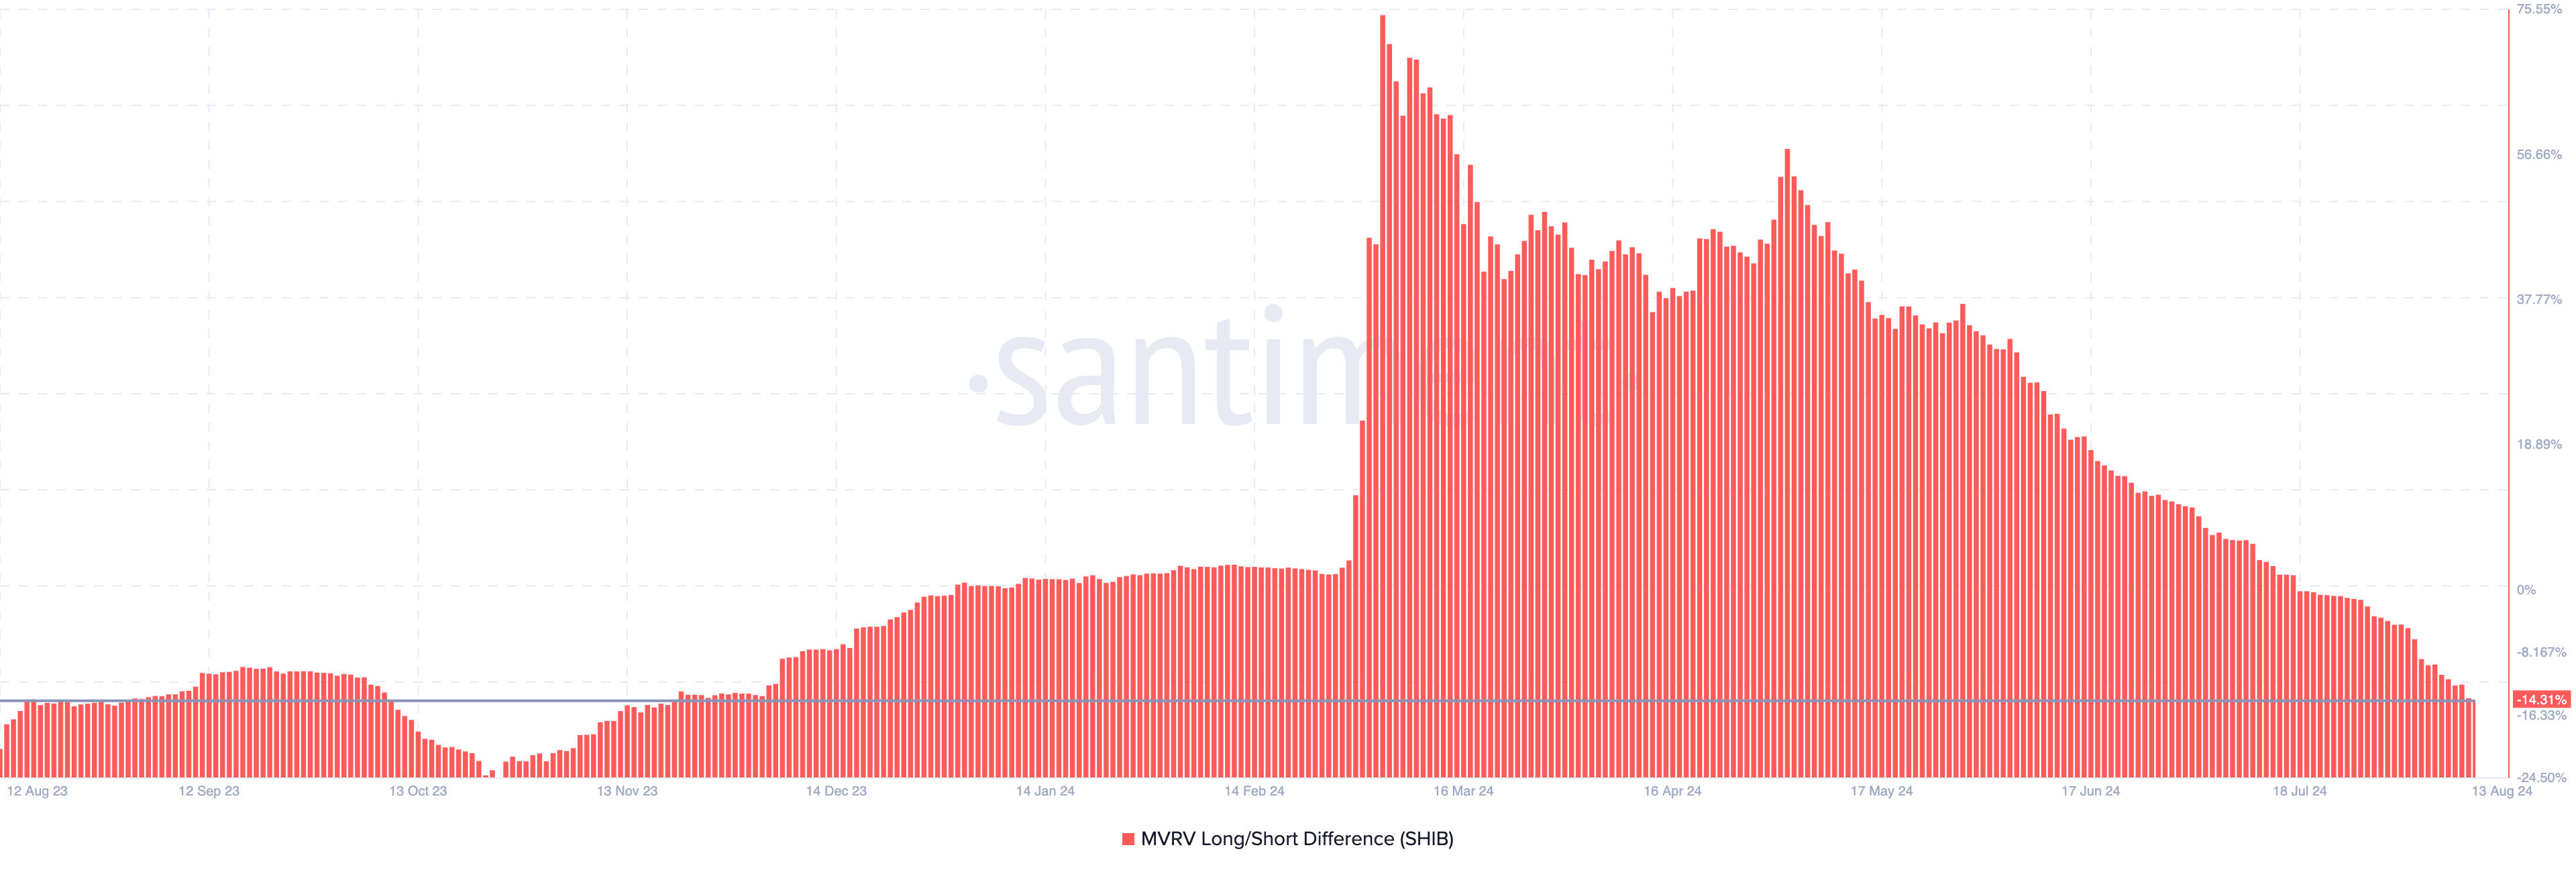 Shiba Inu MVRV Long/Short Difference. Source: Santiment
For example, in October 2023, the metric hit this level. Weeks later, the price of SHIB began to move upward until it reached its yearly peak in March. If this pattern rhymes, the meme coin is only 10% away from hitting the bottom and reversing to the upside.
Short-term holders seem to be gearing up for a potential bullish turnaround. According to IntoTheBlock, the number of holders who accumulated SHIB within the last 30 days has significantly risen: blockchain analytics reveal an 11% increase in the number of traders over this period.
If this trend continues, it signals growing confidence in the short-term potential of Shiba Inu. However, a decline would suggest doubt about the token’s bullish outlook.
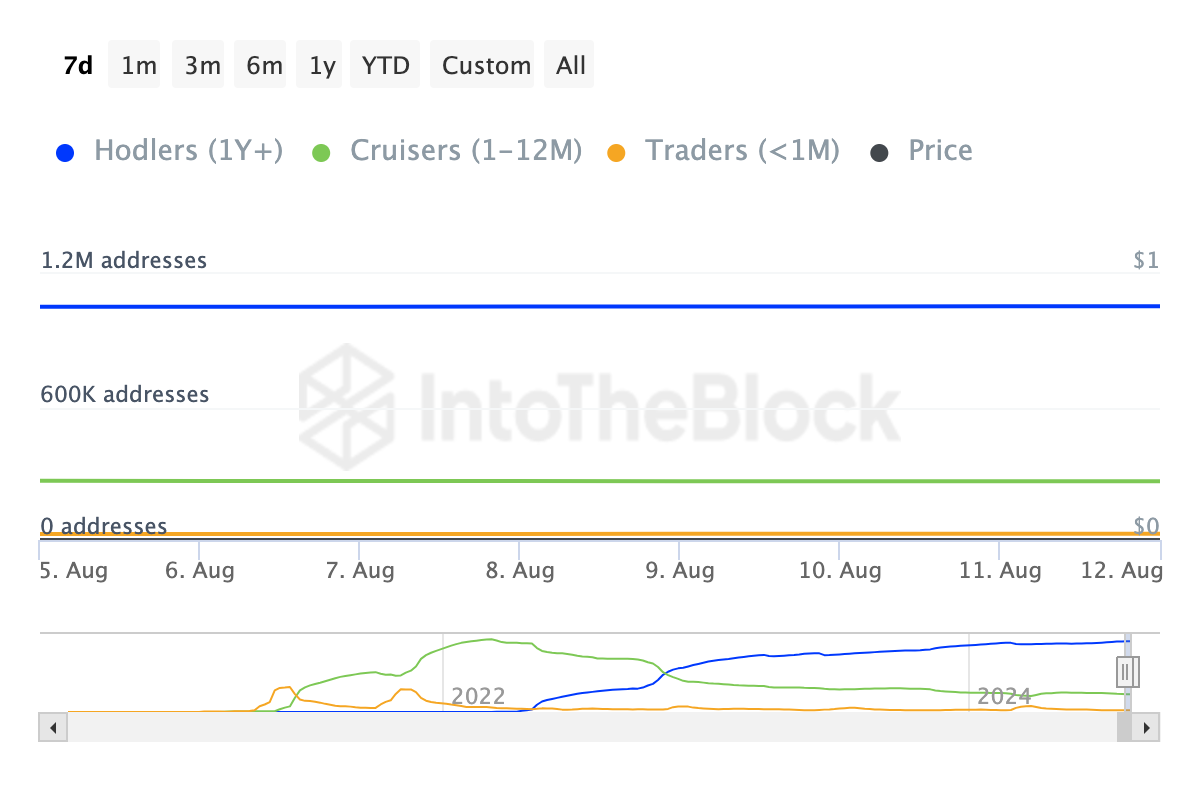 Shiba Inu Addresses by Time Held. Source: IntoTheBlock
SHIB Price Prediction: Down Before Up Only
Shiba Inu Addresses by Time Held. Source: IntoTheBlock
SHIB Price Prediction: Down Before Up Only
According to the daily chart, SHIB’s price has been stuck in a descending channel since July 16. Also referred to as a channel down, the descending channel is a bearish chart pattern formed by two downward trendlines.
In this pattern, the upper trendlines represents resistance while the lower one indicates support. If the price breaks below the lower trendline, the value may continue to slide. However, a break above the upper trendlines will validate a bullish reversal.
At press time, SHIB remains below the upper trendline, suggesting a downtrend looks likely. If this is the case, the price of the token may decline to the $0.000012 support. As shown in the image below, this potential decline represents approximately a 10% decline.
Read More: Shiba Inu (SHIB) Price Prediction 2024/2025/2030
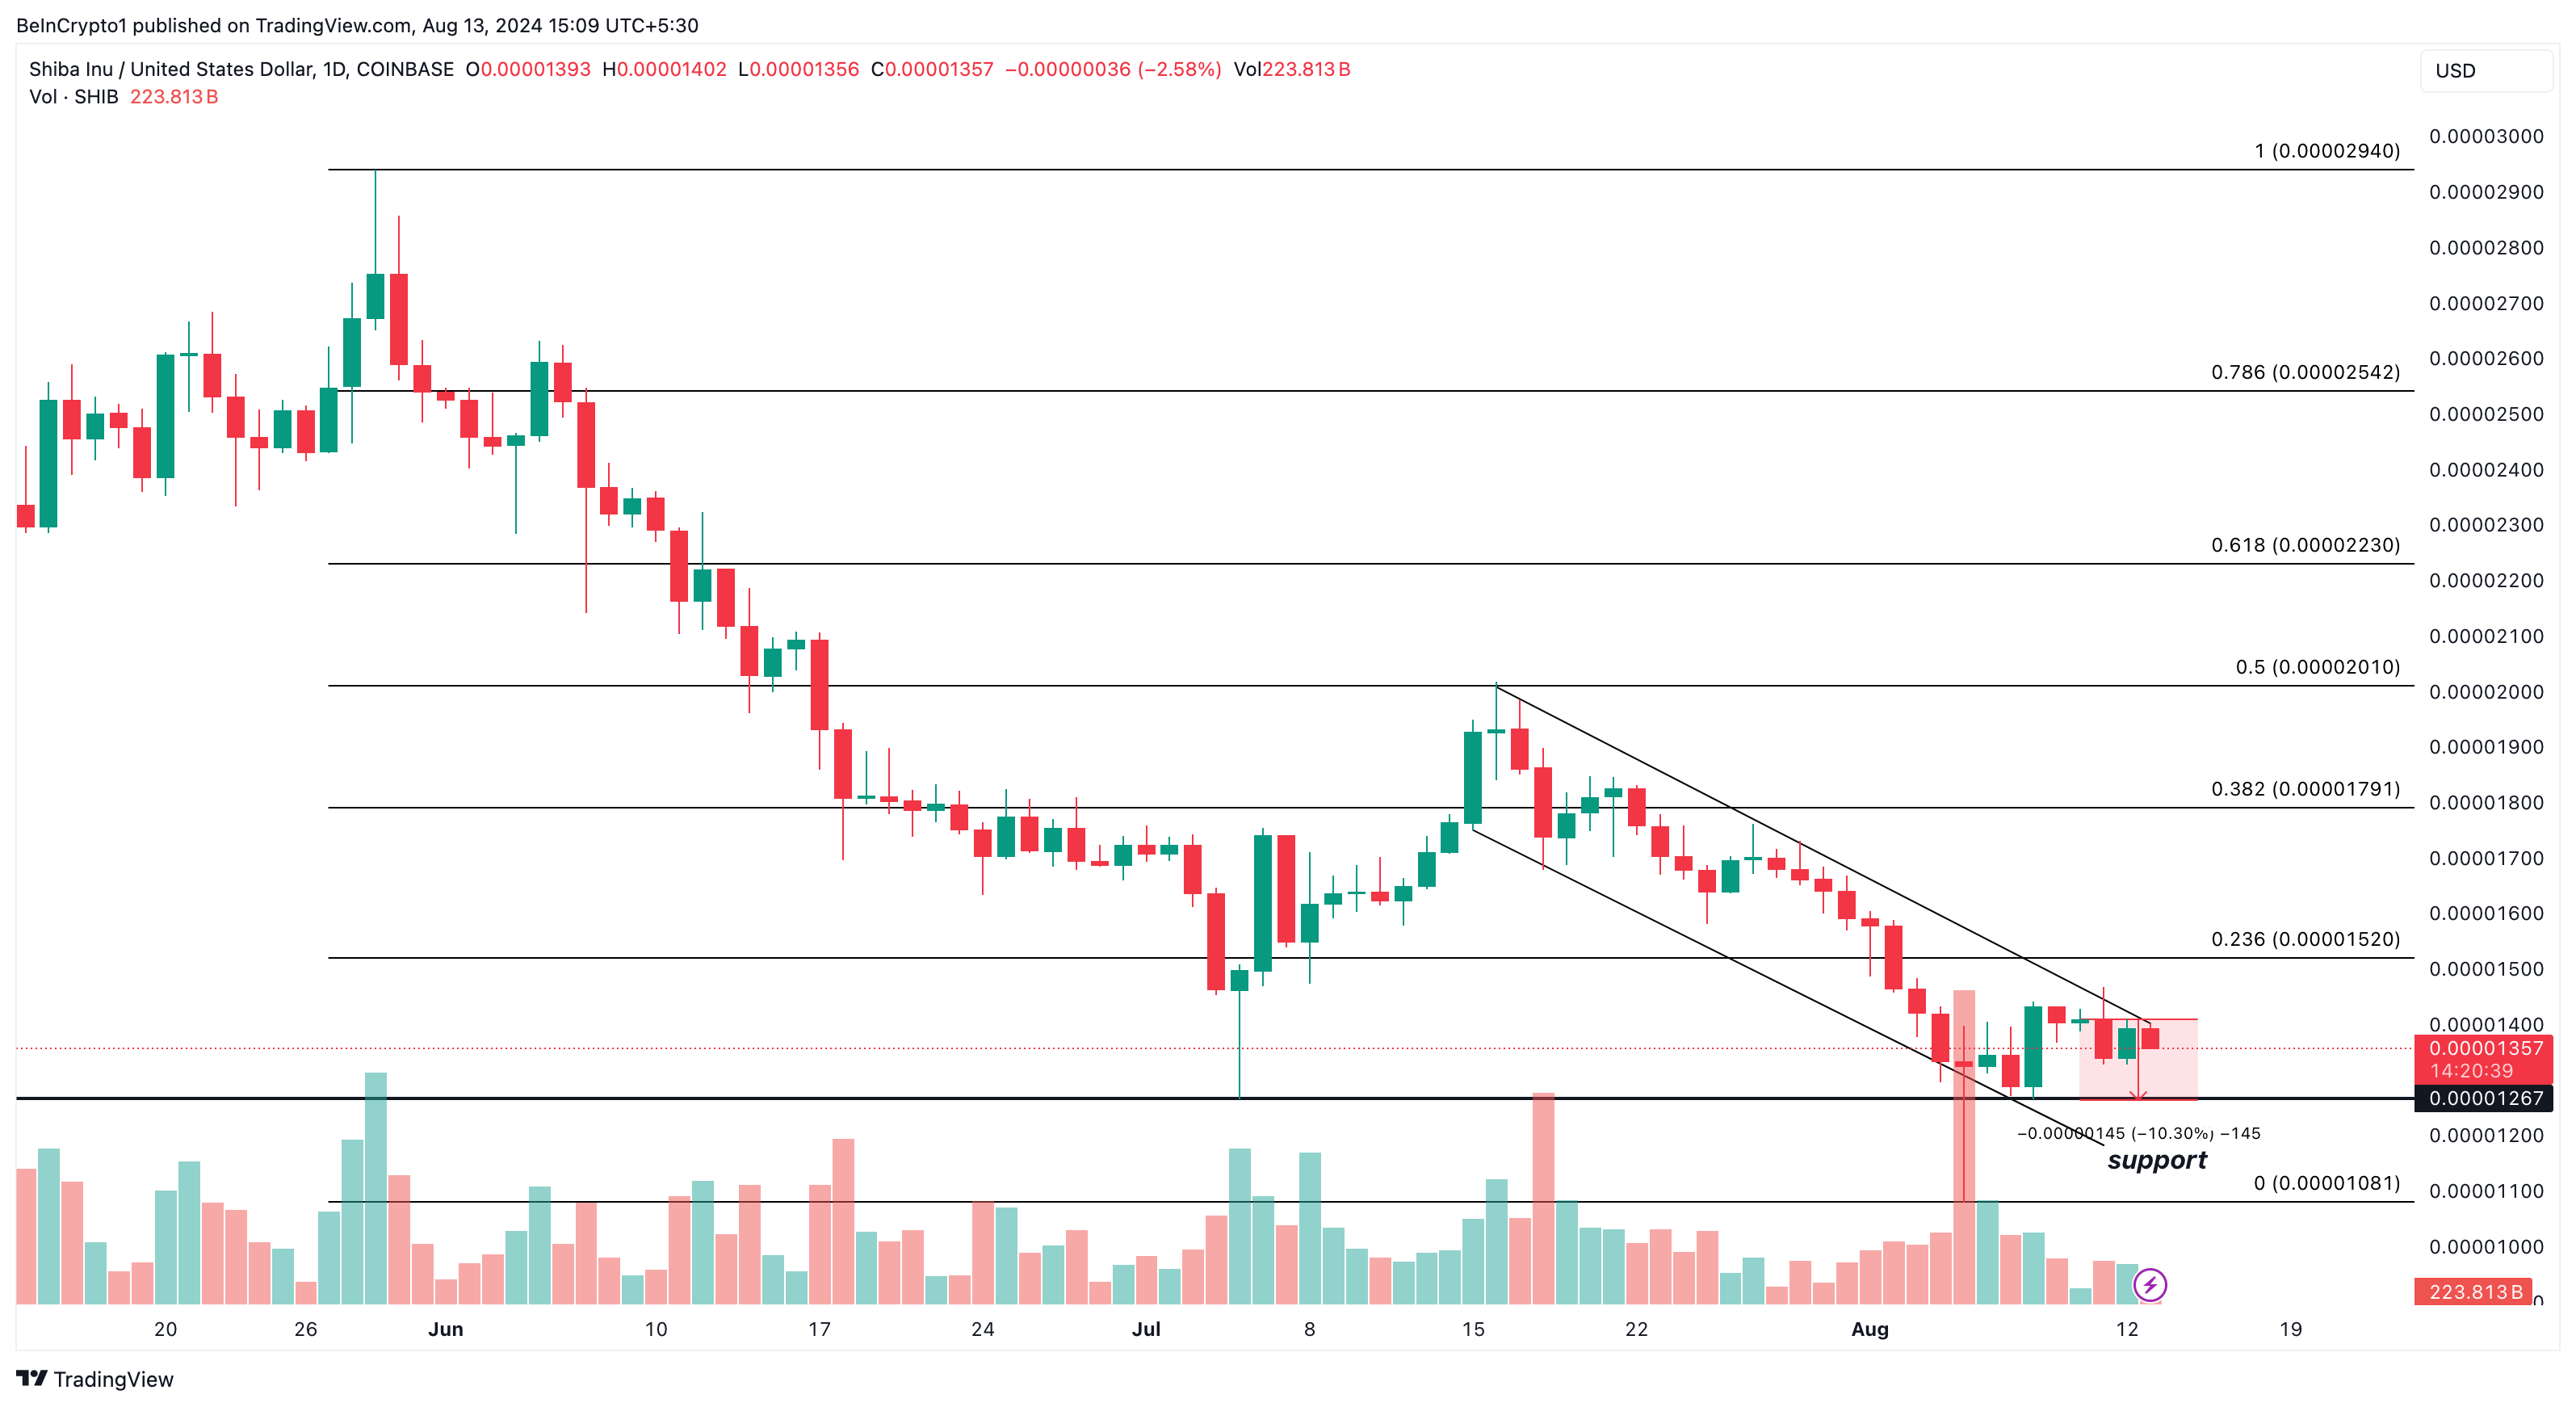 Shiba Inu Daily Analysis. Source: TradingView
Therefore, if SHIB hits $0.000012, there is high chance for the price to reverse and potentially aim $0.000015. However, the price of the token may go lower if holders of the token sell or the price breaks below the lower trendline of the descending channel
The post Shiba Inu (SHIB) Approaches Critical Support, Bottom Could Be 10% Away appeared first on BeInCrypto.