Solana’s 30% Rally Brings SOL to a 3-Year High, Market Cap Rises Above $100 Billion
Solana (SOL) recently achieved a significant price breakout, surpassing the eight-month-old resistance level of $201. Known as an “Ethereum killer” for its scalable blockchain technology, Solana is now the fourth cryptocurrency to reach a market cap of $100 billion.
However, despite this impressive achievement, a strong sell signal may pose challenges to sustaining these gains in the coming days.
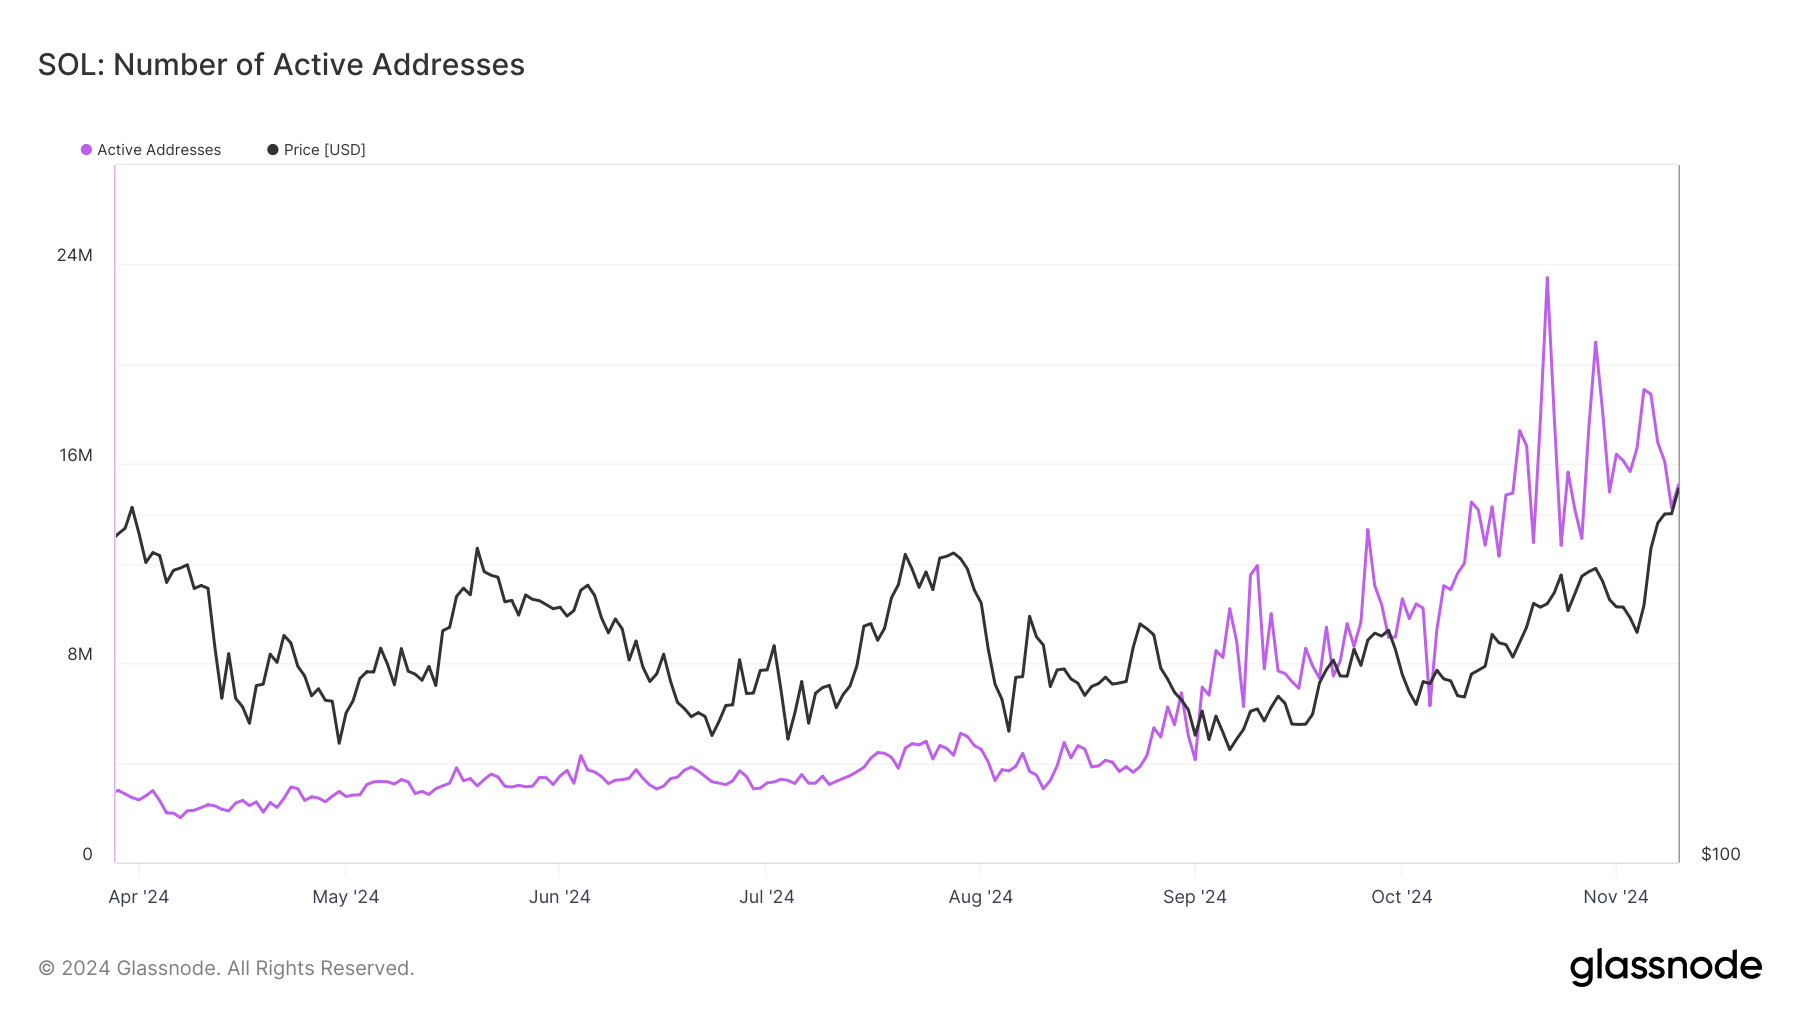
Solana’s Investors Are Pulling BackDespite Solana’s price rally, active addresses on the network are showing a decline. This drop has led to a Price DAA (Daily Active Addresses) Divergence, signaling potential selling pressure. When price rises alongside declining active addresses, it often suggests that fewer investors are engaging with the asset, which can lead to a dip in momentum.
This divergence between Solana’s price and active addresses may signal caution. The sell signal generated by this indicator reflects uncertainty among market participants, possibly curbing further gains. If this trend persists, it could trigger a wave of profit-taking as investors look to lock in recent gains, impacting SOL’s price stability.
 Solana Active Addresses. Source: Glassnode
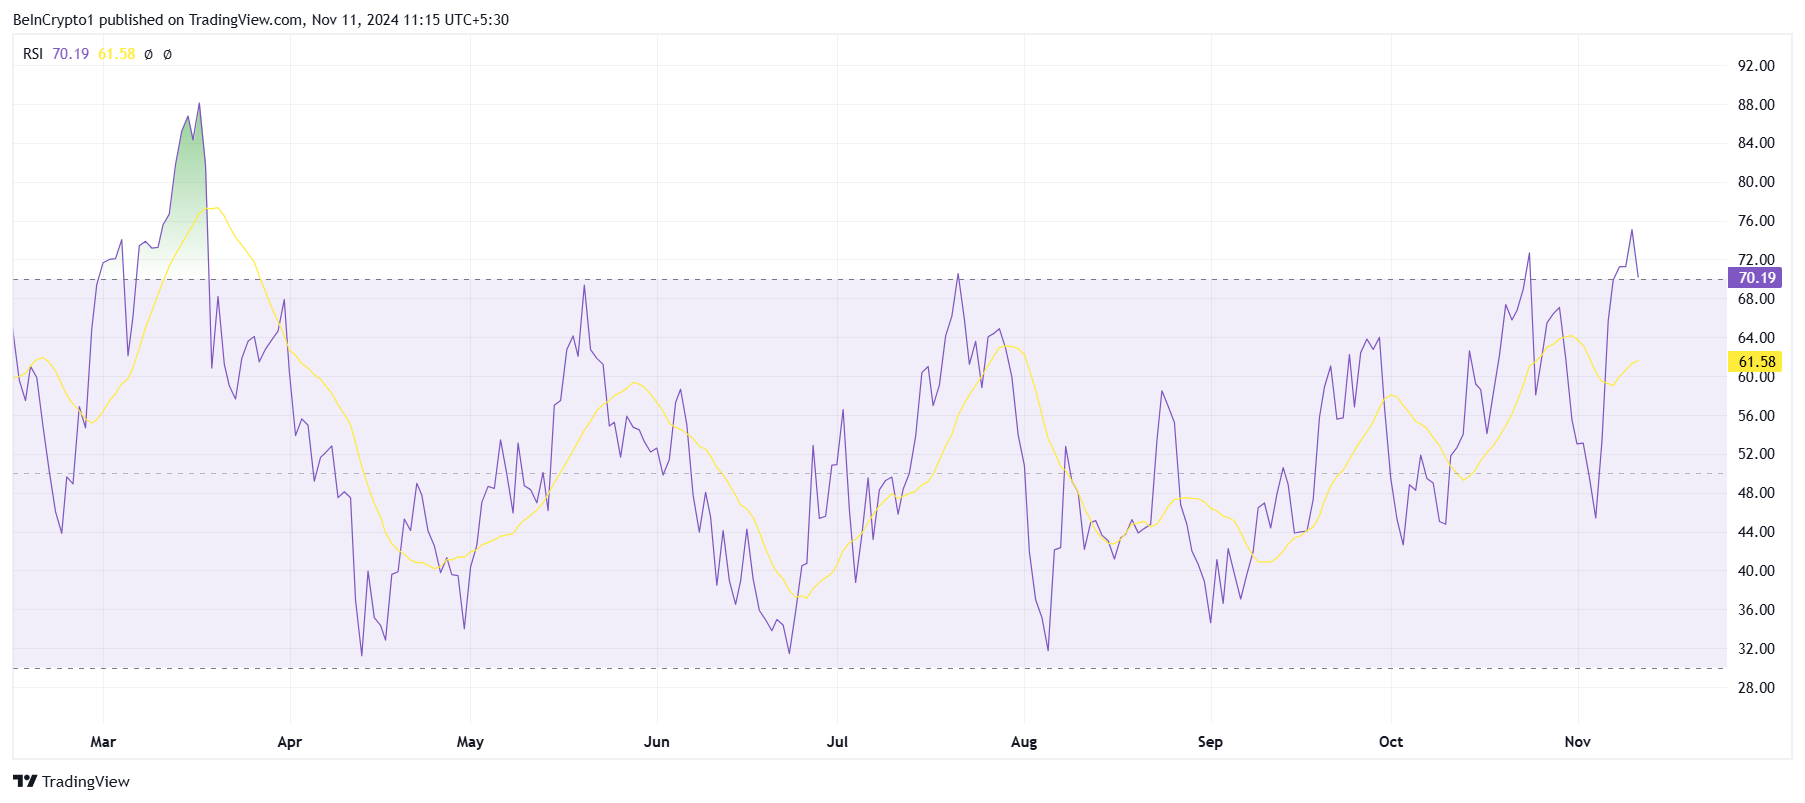
Solana’s macro momentum is exhibiting signs of overextension. The Relative Strength Index (RSI), a key technical indicator, currently shows Solana in the overbought zone.
Historically, this has often led to short-term corrections as prices become overvalued. If the RSI remains elevated, it may signal a potential reversal, leading to a temporary price drop.
This overbought status on the RSI suggests that Solana’s upward momentum may face challenges if investor enthusiasm cools. The risk of reversal is heightened, as previous instances of high RSI readings have often been followed by profit-taking. Traders are advised to watch the RSI closely, as further gains may depend on it moving out of the overbought territory.
 Solana RSI. Source: TradingView
SOL Price Prediction: Preventing a Reversal
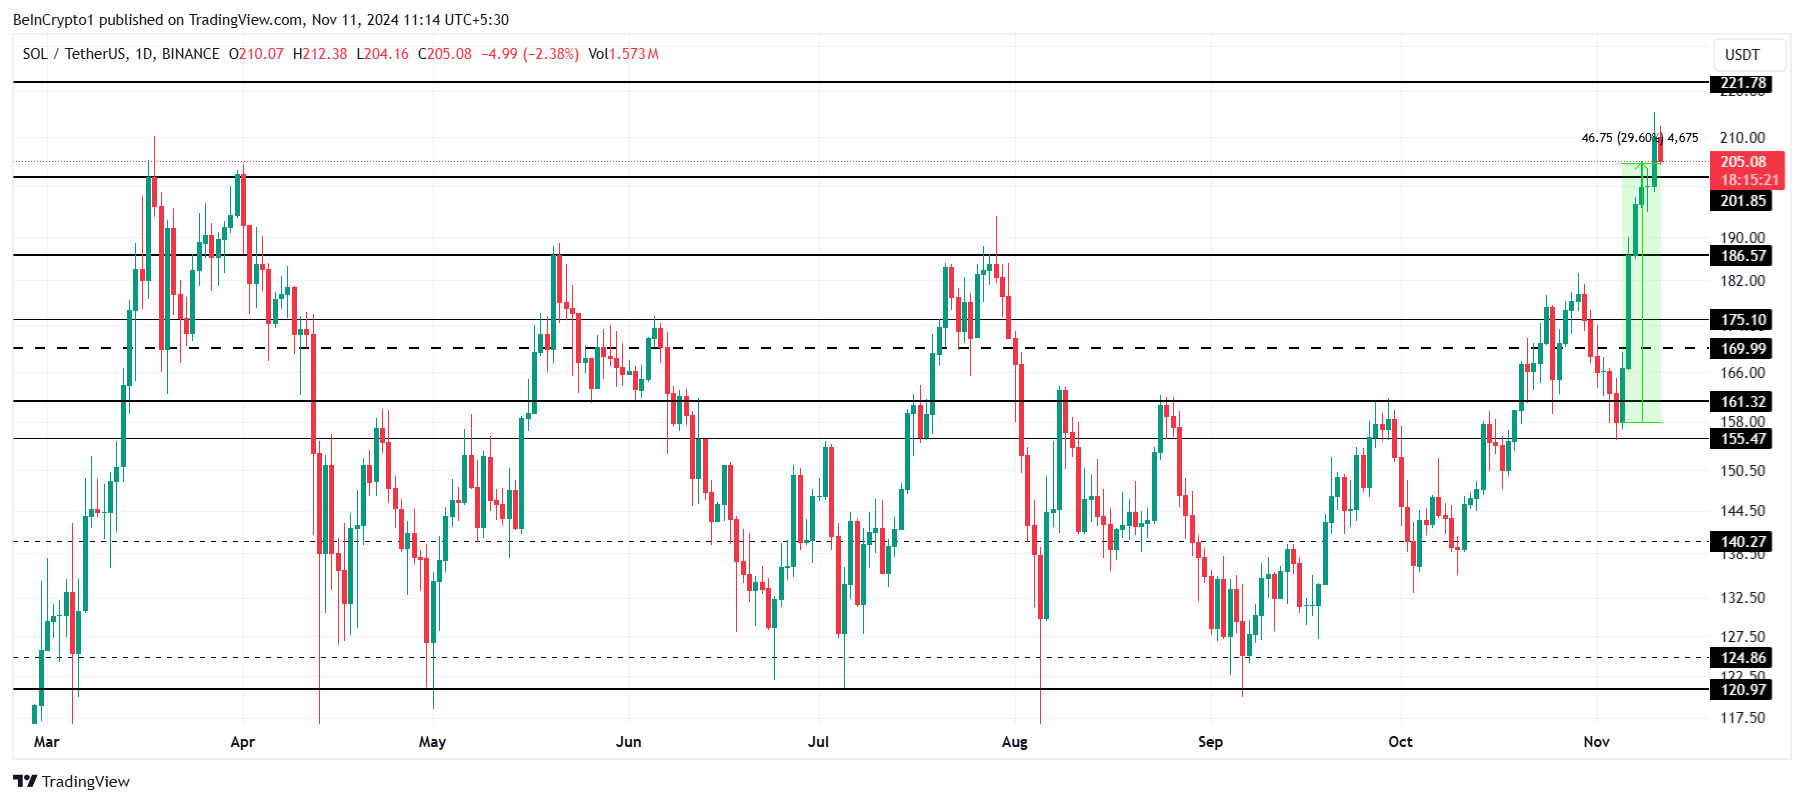
Solana price’s rally propelled it to a three-year high of $215, with SOL currently trading at $205. However, with declining address activity and an overbought RSI, Solana’s price is nearing a likely support level at $201. A failure to hold this level could lead to further declines.
If investors begin to book profits, Solana may fall toward $186, a critical support floor for the altcoin. Holding above $186 is essential for maintaining the recent uptrend, as breaking below this level could signal deeper corrections.
 Solana Price Analysis. Source: TradingView
Conversely, if Solana rebounds from the $201 support level, it may attempt to break past the next key resistance at $221. Surpassing this level would likely push Solana’s market cap back above $100 billion, reinstating bullish momentum and countering the current bearish outlook.
The post Solana’s 30% Rally Brings SOL to a 3-Year High, Market Cap Rises Above $100 Billion appeared first on BeInCrypto.
