Stellar (XLM) Price Bullish Momentum Fades After 94% Weekly Gains
Stellar’s (XLM) price has been down over 10% in the last 24 hours but has remained up 94.07% in the past week, leading to gains among the top 100 cryptocurrencies. Indicators like the RSI and Ichimoku Cloud suggest weakening bullish momentum as XLM faces growing selling pressure.
If the downtrend continues, XLM could test key support at $0.099. However, a recovery could push it back toward $0.638 and potentially as high as $0.70.
XLM RSI Slips to Neutral ZoneStellar RSI is now at 48.31, down from above 70 when XLM hit $0.60, its highest price in three years. The RSI, or Relative Strength Index, measures momentum on a scale from 0 to 100, with values above 70 signaling overbought conditions and below 30 suggesting oversold conditions.
The drop in RSI reflects reduced bullish momentum as XLM faces a correction.
 XLM RSI. Source: TradingView
An RSI of 48.31 places XLM in a neutral zone, neither overbought nor oversold. This level suggests that Stellar price could continue dropping before a new surge takes place.
However, if RSI stabilizes or rises, XLM could regain upward momentum and resume its bullish trend.
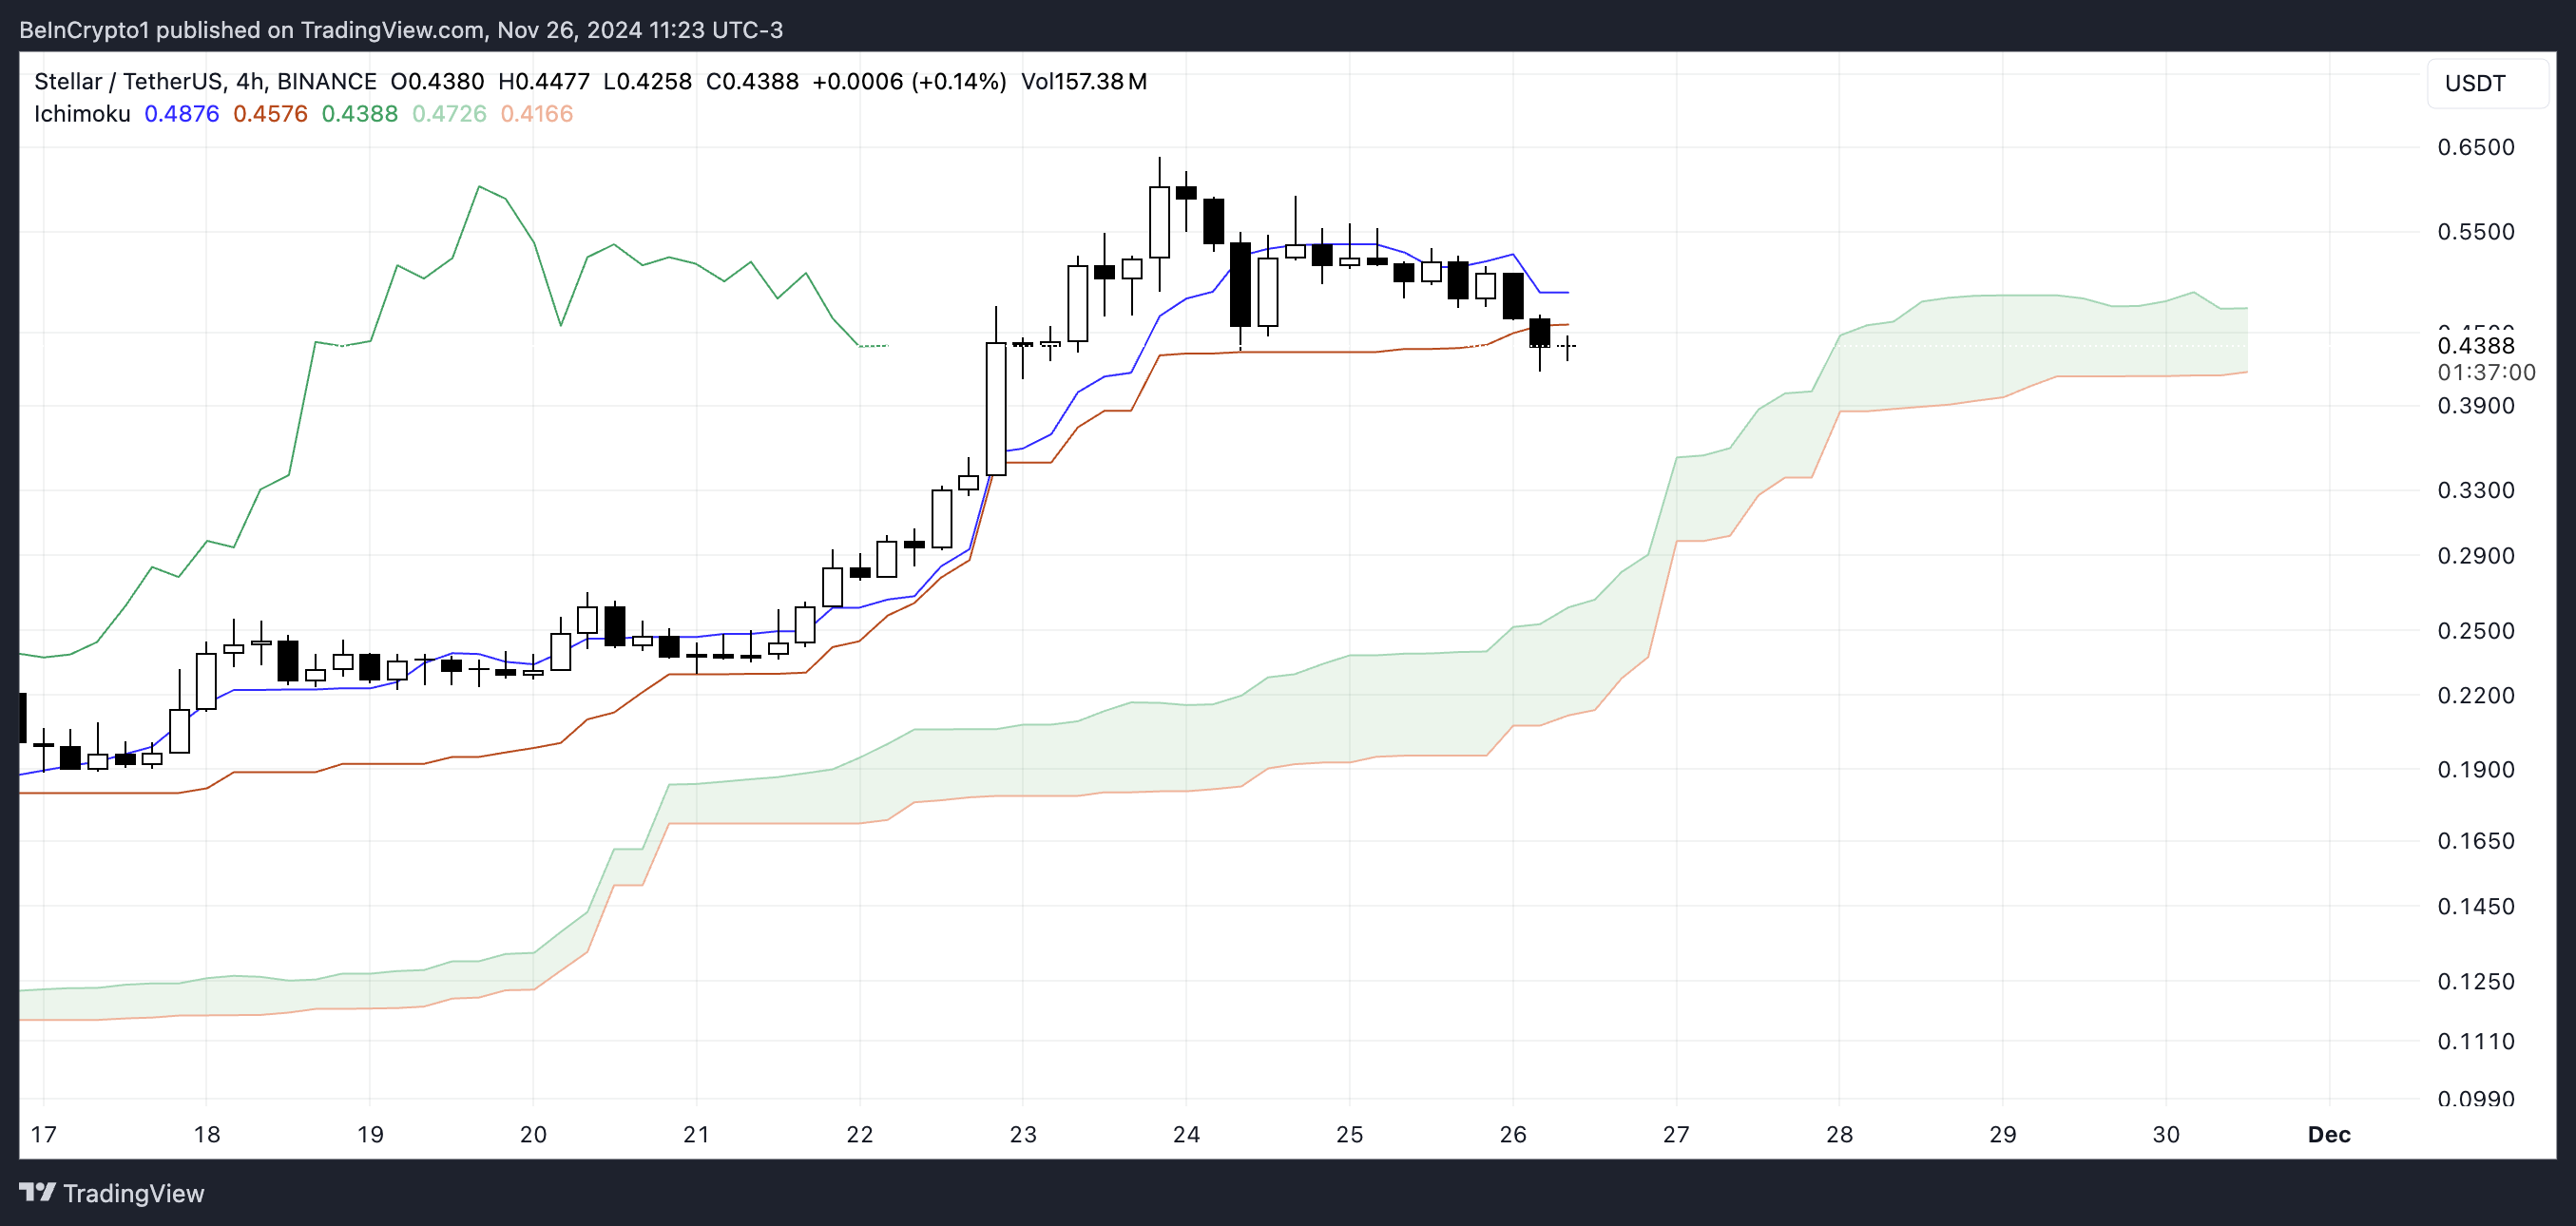
Stellar Ichimoku Cloud Shows Bearish Trend Is AppearingThe Ichimoku Cloud chart for Stellar shows bearish momentum taking over as the price has moved below the Kijun-Sen (orange line) and Tenkan-Sen (blue line).
This indicates weakening bullish sentiment, with the price nearing the edge of the cloud (Senkou Span A and B), which currently provides short-term support. If the price falls further into or below the cloud, it could confirm a bearish trend reversal.
 XLM Ichimoku Cloud. Source: TradingView
The cloud itself remains bullish in structure for now, with a rising Senkou Span A, but its thinning nature suggests weakening support ahead.
If XLM fails to reclaim levels above the Tenkan-Sen and Kijun-Sen, selling pressure may intensify. However, if the price recovers and moves above the cloud, it could signal the resumption of the recent bullish trend.
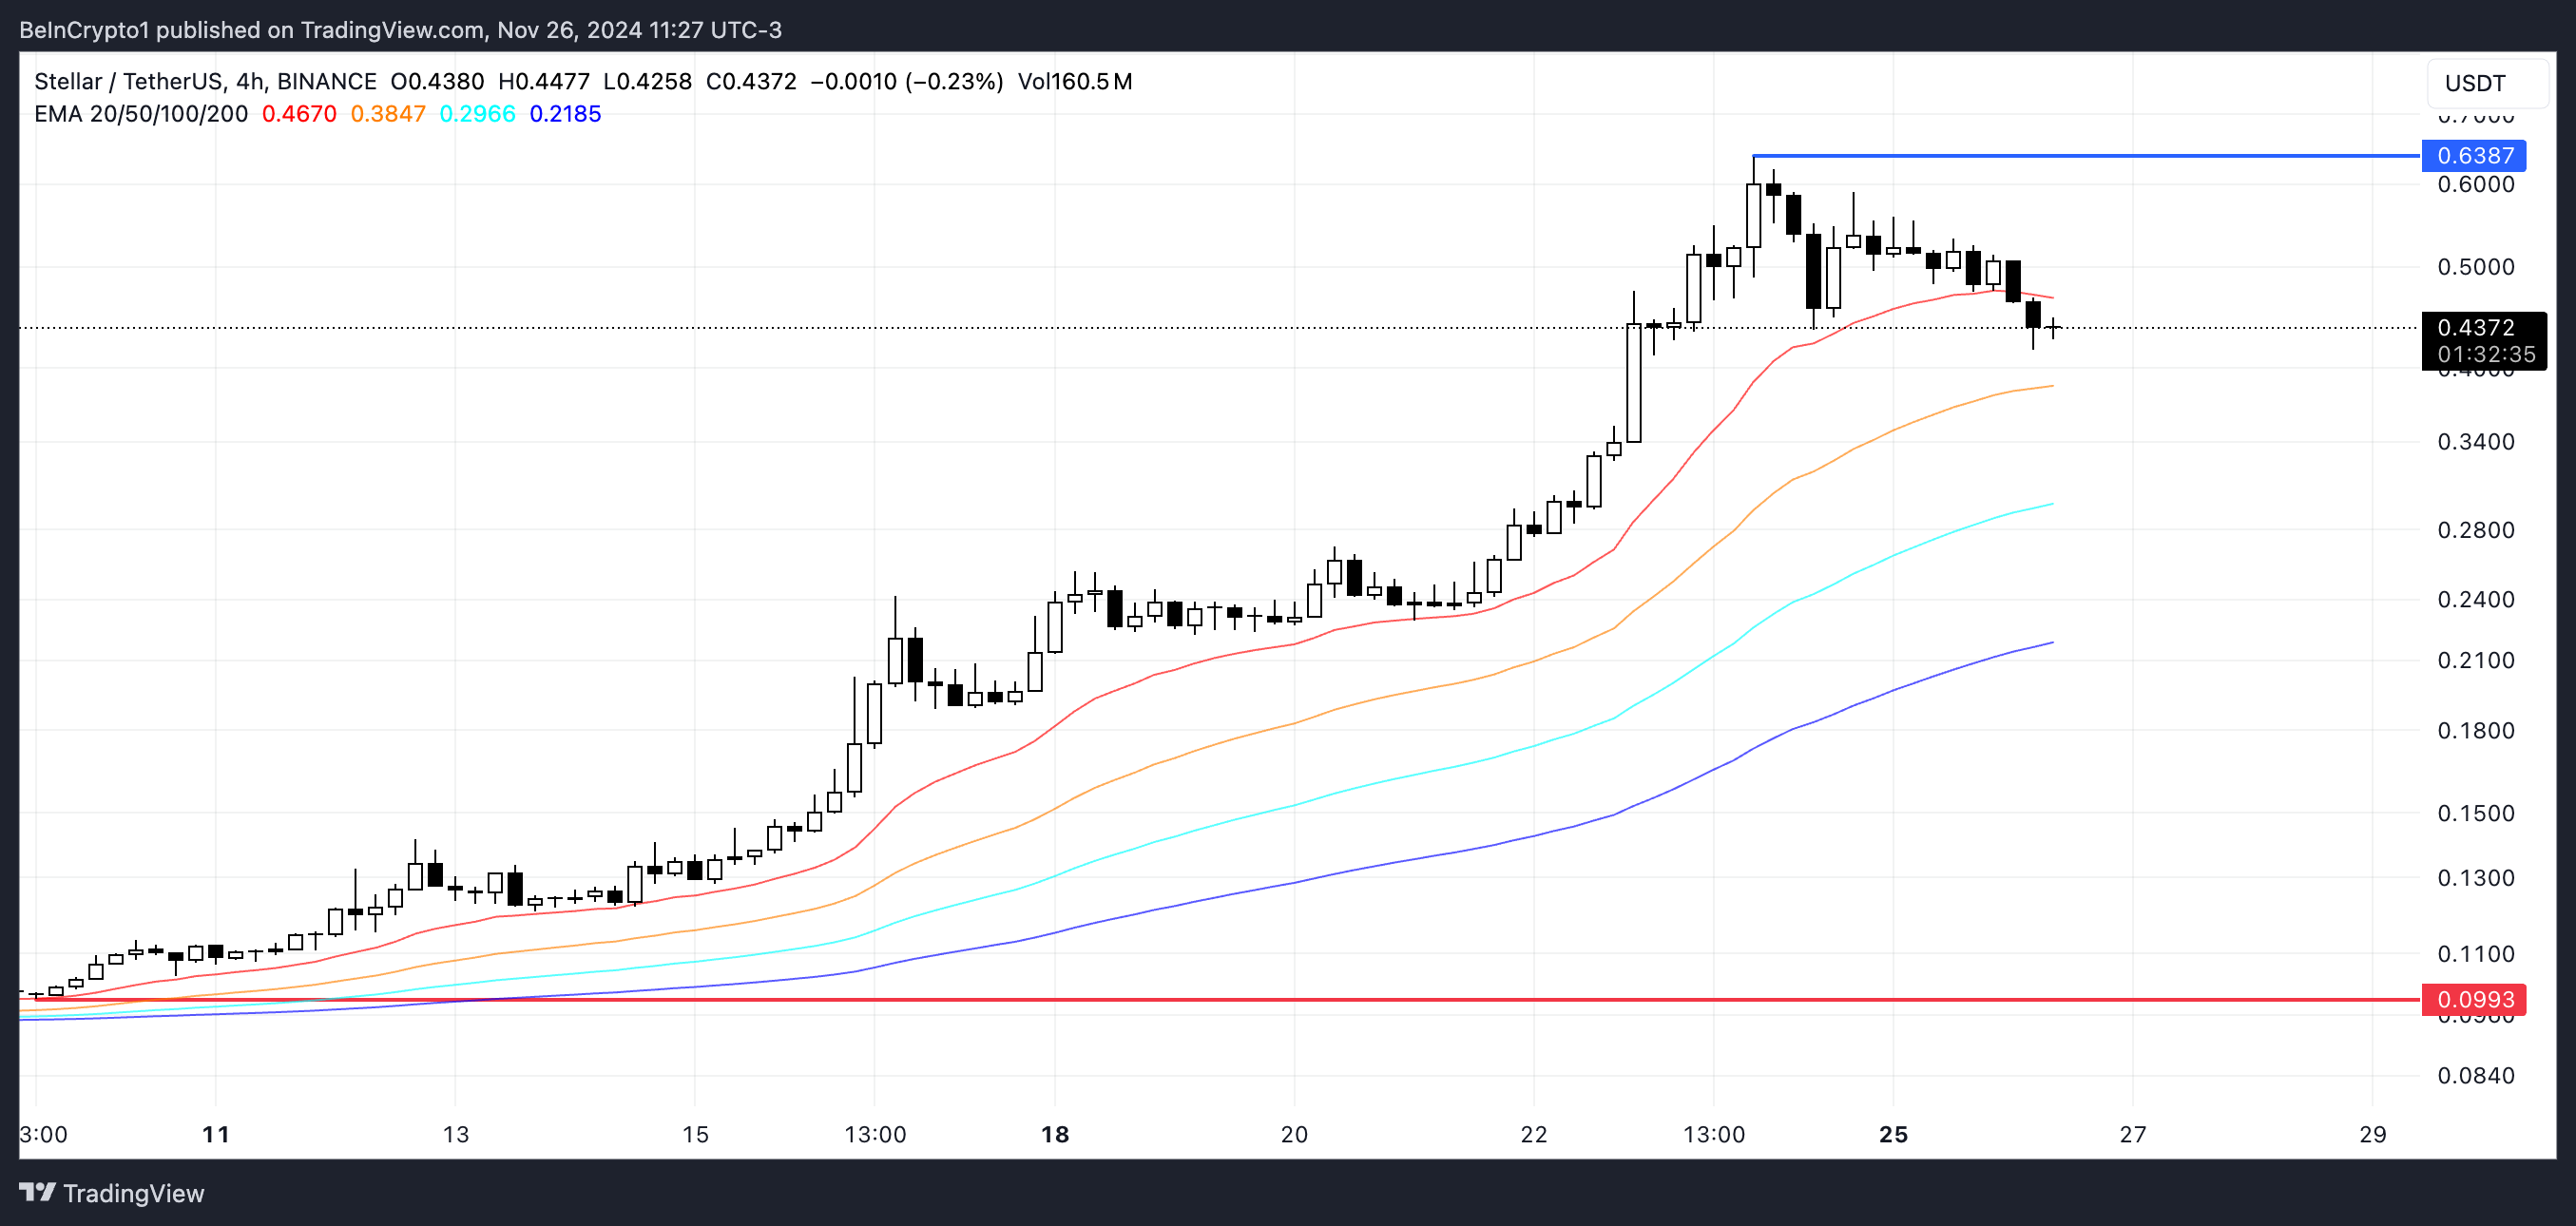
XLM Price Prediction: A Strong Correction If Buying Pressure Doesn’t Get BackStellar EMA lines remain bullish, with short-term lines above the long-term ones, indicating an overall upward trend. However, the narrowing gap between these lines suggests weakening bullish momentum and a potential shift in sentiment.
This signals that the ongoing downtrend could accelerate if XLM buying pressure doesn’t return soon.
 XLM Price Analysis. Source: TradingView
If the downtrend strengthens, XLM price could see a sharp drop to its strong support at $0.099, representing a significant 76% correction.
On the other hand, if Stellar price regains its recent bullish momentum, it could retest resistance near $0.638. Breaking past this level might push XLM toward $0.70, offering a potential 62% upside from current levels.
The post Stellar (XLM) Price Bullish Momentum Fades After 94% Weekly Gains appeared first on BeInCrypto.
