SUI Bears Push Price Below Support, 10% Drop Expected
If the current technical setup is any indication to follow, Sui (SUI) could see its price drop below $2. On October 14, the token of the Layer-1 Move-programmed blockchain reached a new all-time high of $2.36.
Since then, the altcoin has faced challenges in moving higher, and this analysis explains why SUI might be poised for an extended correction.
Sui Slides Down the Ascending ChannelA look at the SUI/USD 4-hour chart shows that the token has been trading within a rising parallel channel since last month. The rising parallel channel pattern forms when traders connect higher highs and higher lows with two ascending parallel trendlines. The upper trendline connects the highs, while the lower trendline connects the low
This technical pattern is typically a bullish signal, suggesting that a cryptocurrency’s value could increase. However, this only occurs if the price remains above the support line of the lower trendline.
In SUI’s case, the lower trendline support is at $2.03, and as shown below, SUI’s price is approaching that zone. If the price drops below this level, a significant downswing could follow.
Read more: A Guide to the 10 Best Sui (SUI) Wallets in 2024
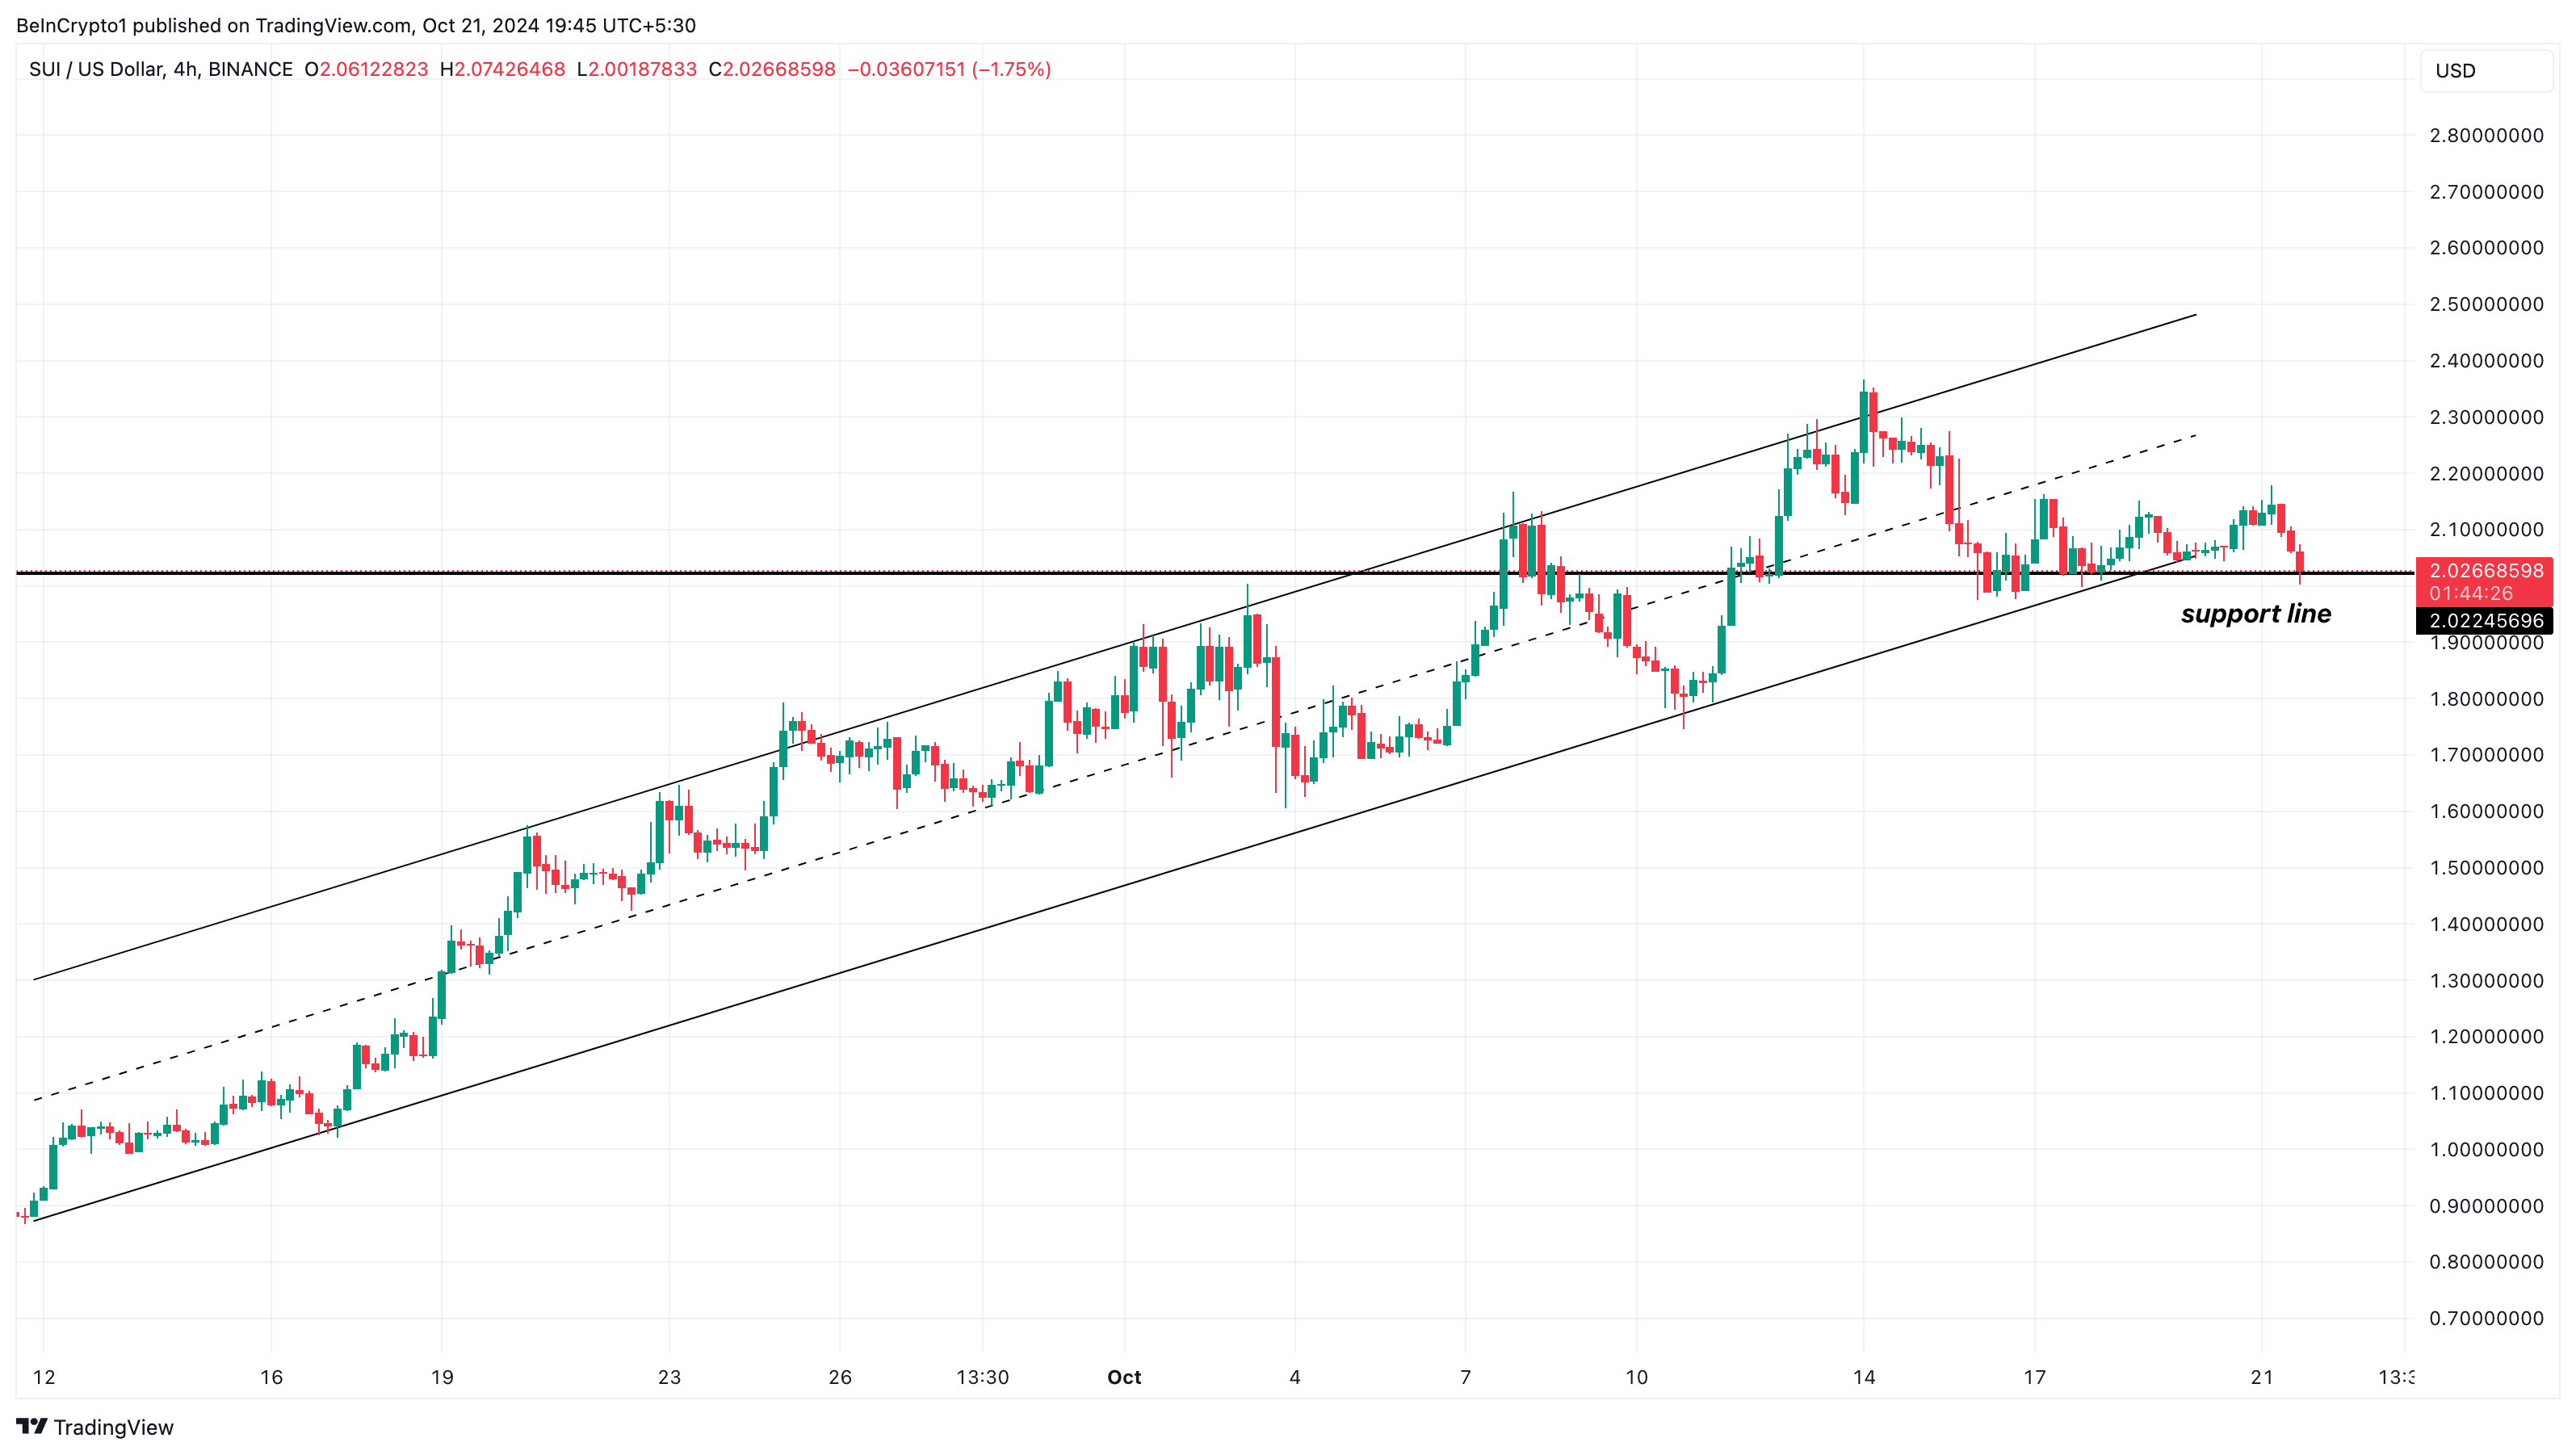 Sui 4-Hour Price Chart. Source: TradingView
Additionally, the same timeframe reveals that the Bull Bear Power (BBP) has turned negative. The BBP is a technical oscillator that measures the relative strength of buyers versus sellers in the market.
When the BBP is positive, bulls dominate, and the price tends to rise. Conversely, a negative BBP indicates that bears are in control. As seen below, the BBP has experienced a sharp decline, suggesting that SUI bears could push the price lower.
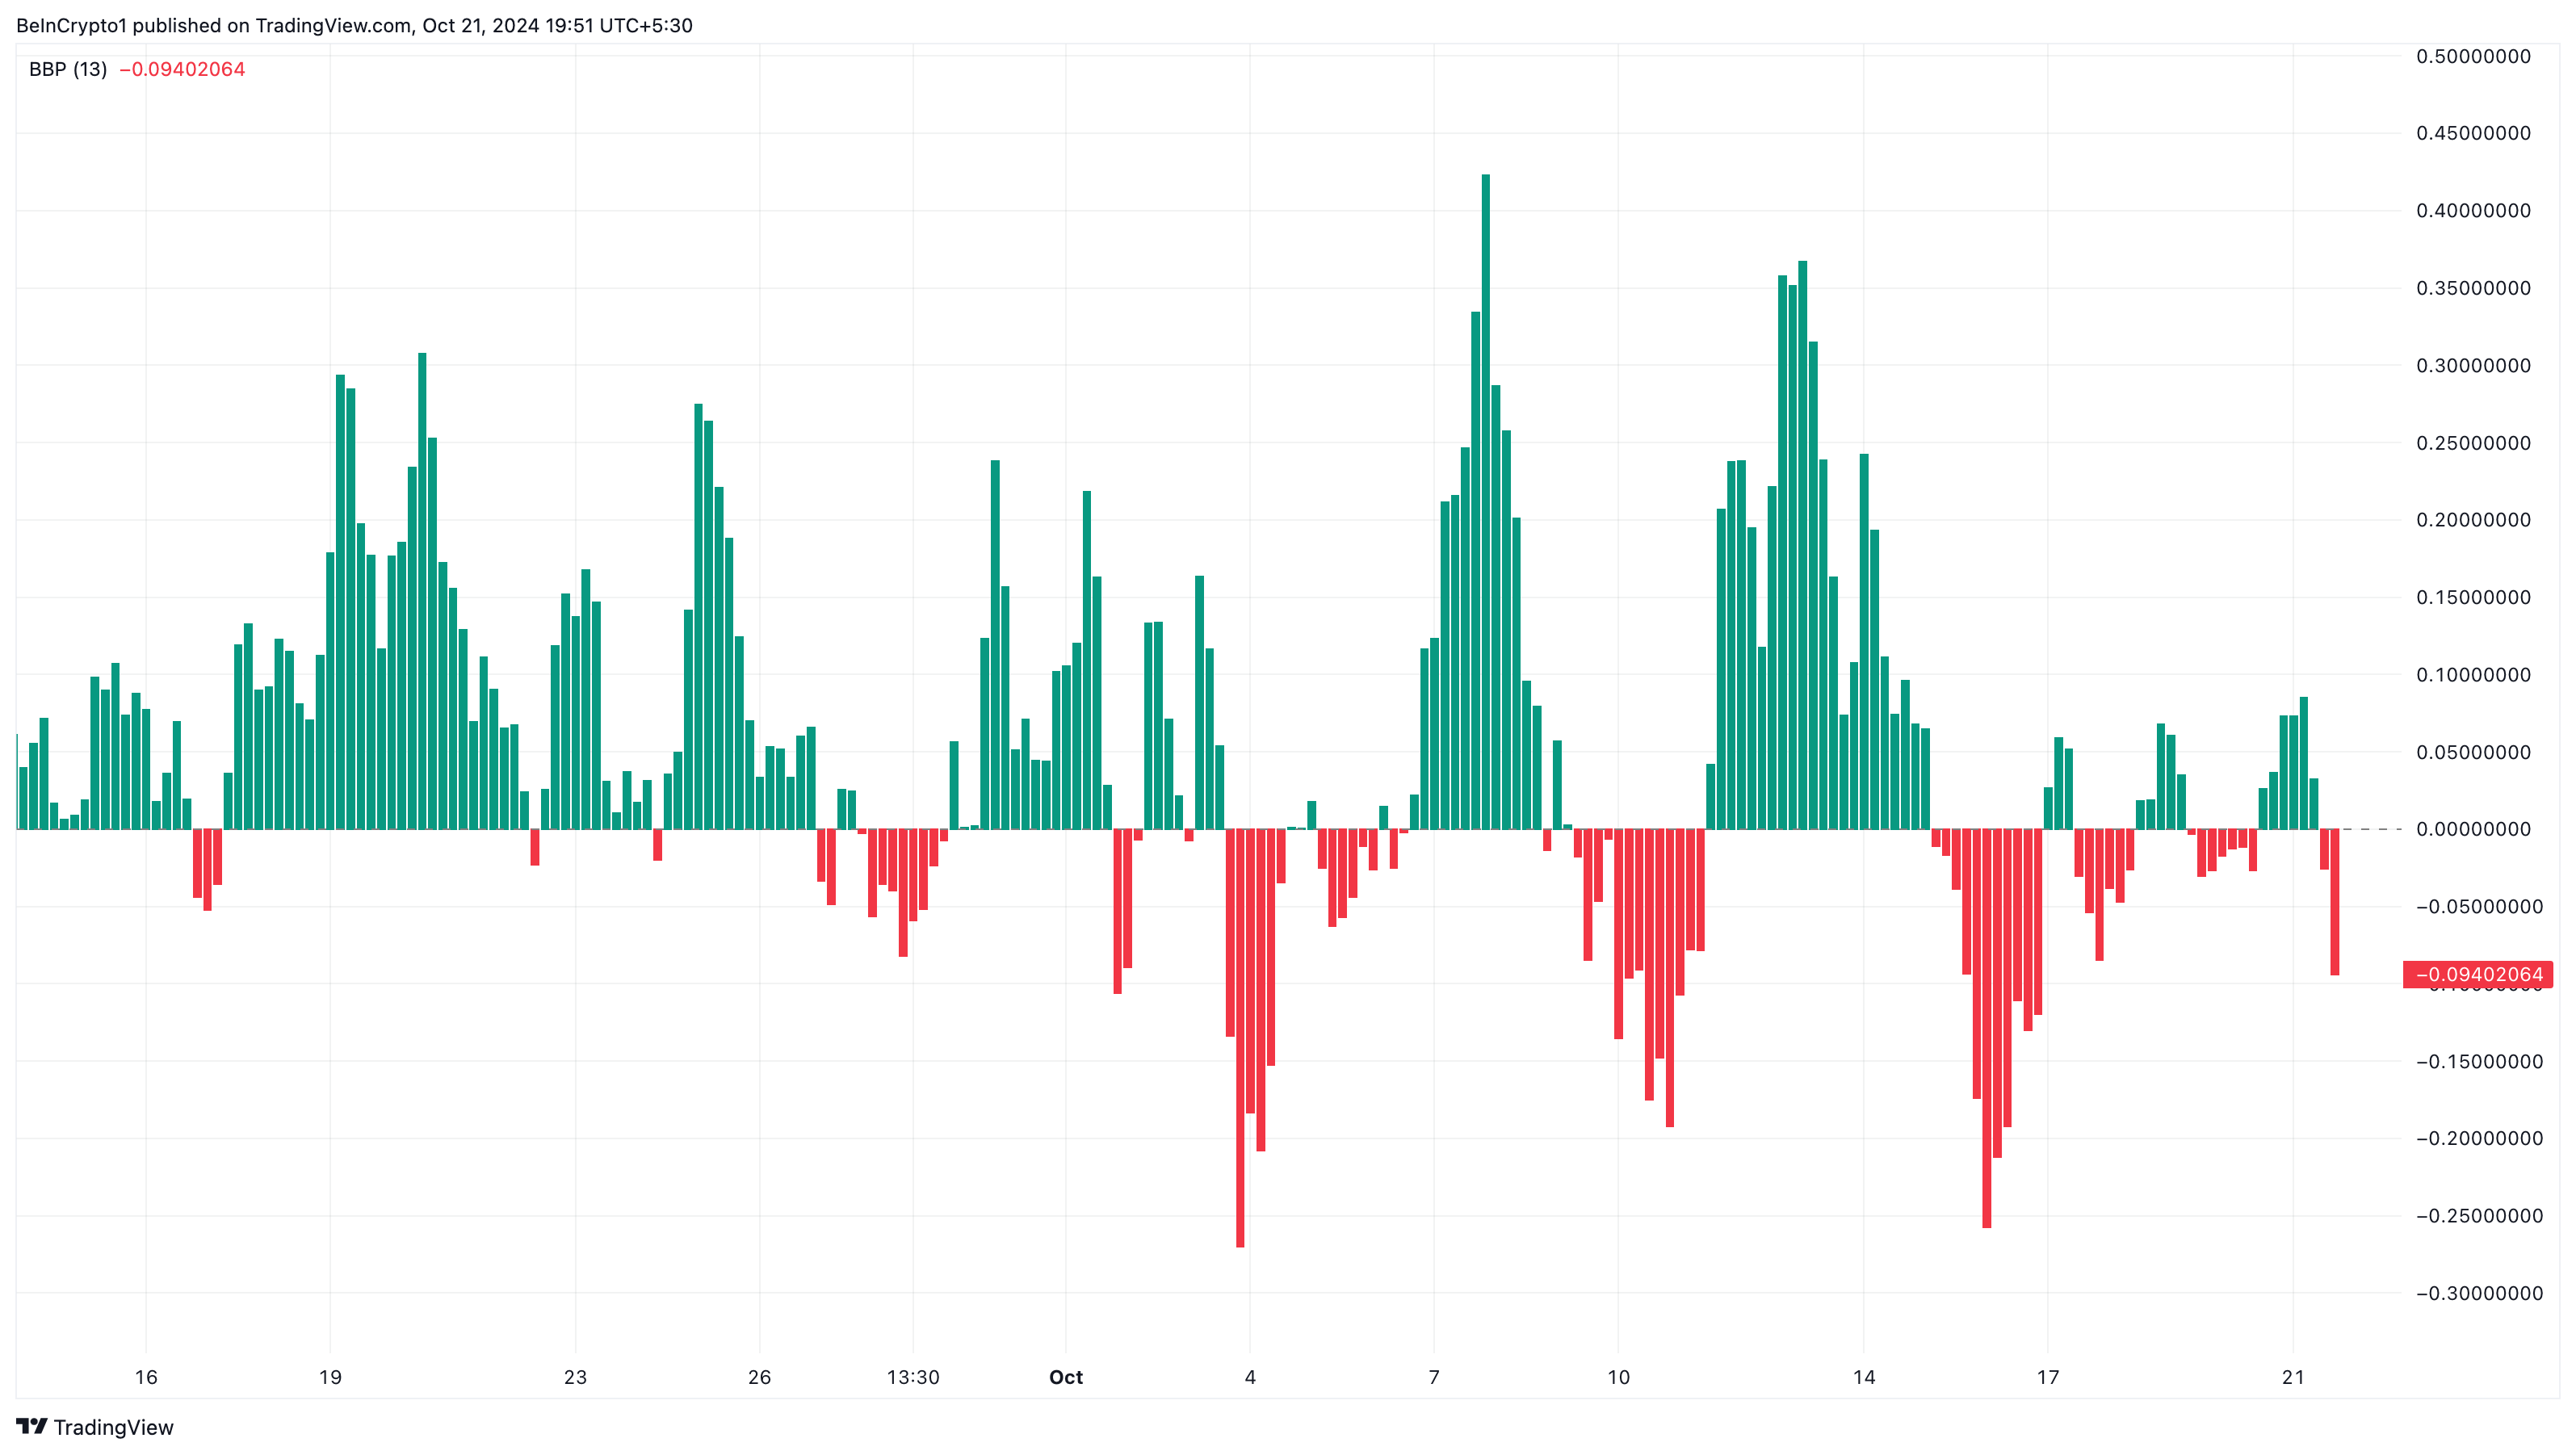 Sui Bull Bear Power. Source: TradingView
SUI Price Prediction: No Way Out of the Drop
Sui Bull Bear Power. Source: TradingView
SUI Price Prediction: No Way Out of the Drop
Meanwhile, the daily chart also appears to be in line with the bearish bias. For instance, the Moving Average Convergence Divergence (MACD) has dropped to the negative region, just like the BBP.
It is historically a good strategy to buy when the MACD rises to the positive zone. This is because the reading during that period means that momentum is bullish, and prices can rise. However, a negative MACD, as it is with SUI, implies that momentum is bearish, indicating a sell signal.
Because of this condition, SUI’s price might likely experience a 10% decline that could take it to $1.83. In a highly bearish condition and volatile market, the altcoin might drop as low as $1.64.
Read more: Top 11 Platforms To Trade the Cheapest Cryptocurrencies
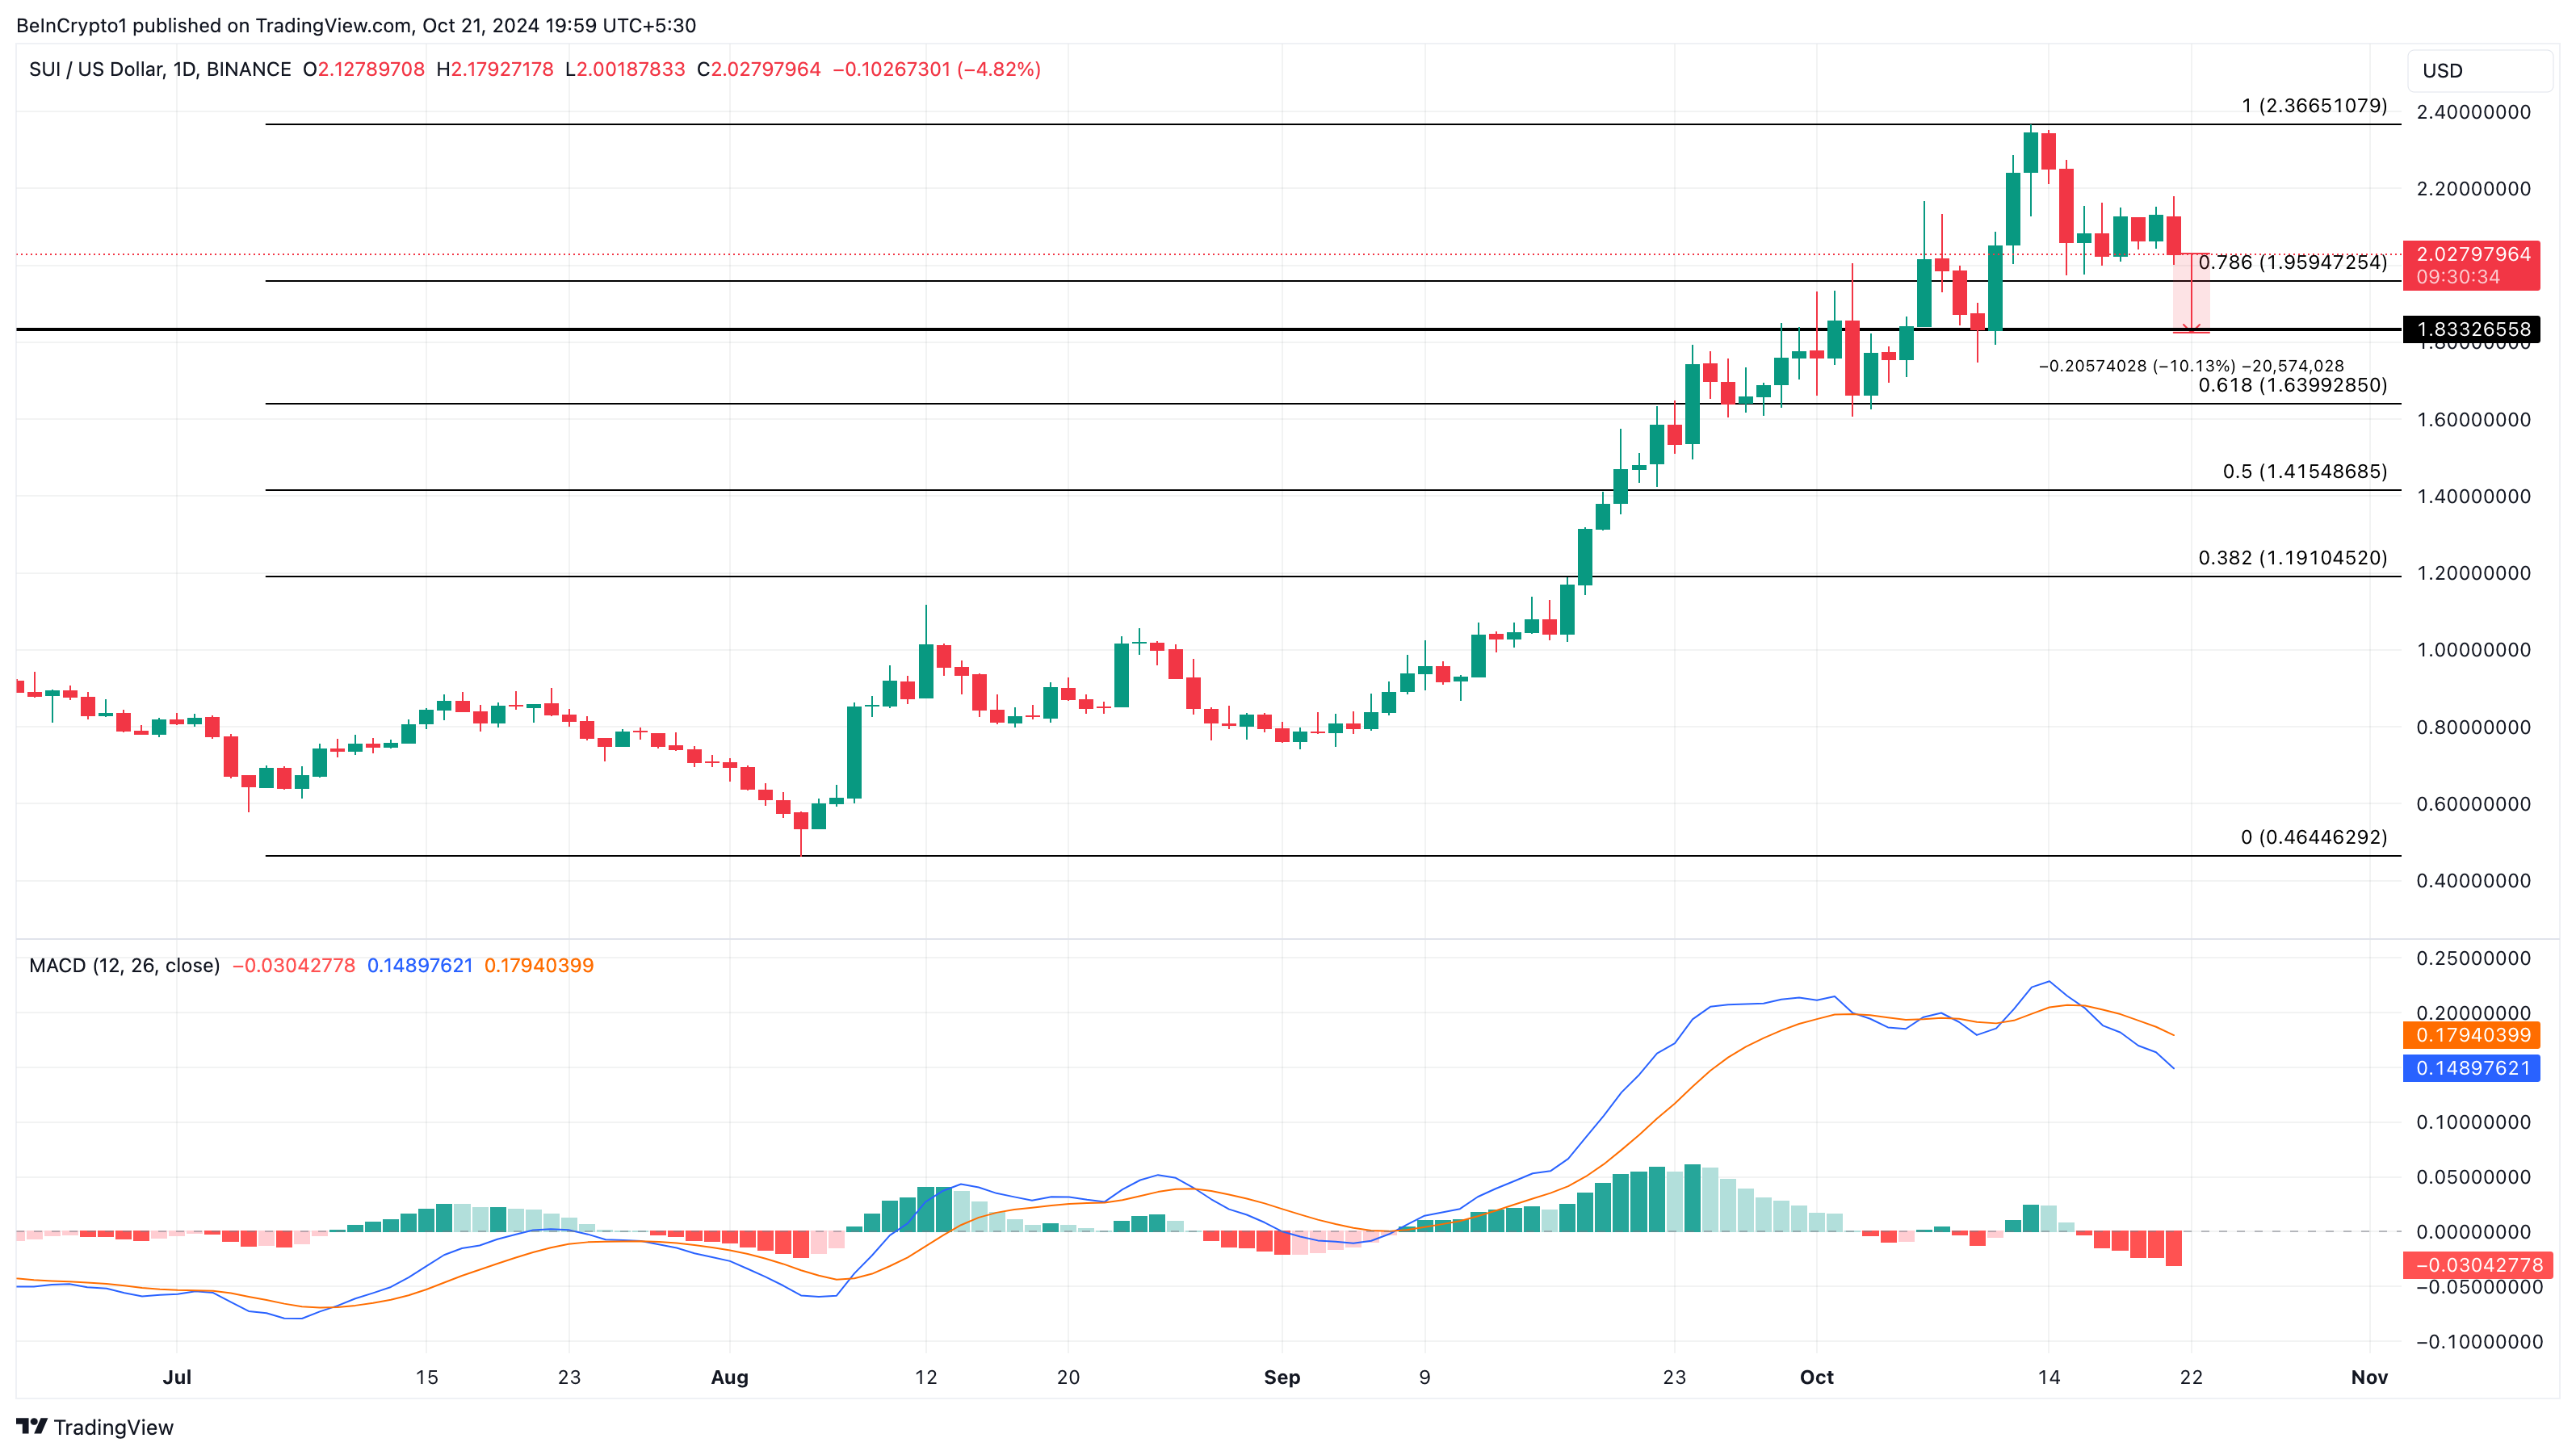 Sui Daily Price Analysis. Source: TradingView
But if bulls come into the picture, this prediction might be invalidated. In that case, SUI might bounce to $2.36 again.
The post SUI Bears Push Price Below Support, 10% Drop Expected appeared first on BeInCrypto.