Why Is Solana(SOL) Price Down Today?
The post Why Is Solana(SOL) Price Down Today? appeared first on Coinpedia Fintech News
Despite all the favorable market momentum, meme coin growth, ETF Approval, community governance vote for the validator, and PayPal launching the PYUSD stable coin on the Solana network, the Solana (SOL) price is declining for a week.
The leading meme coins network, SOL, jumped today on 30 May from $176.8 to $165 with a shift from a bullish to a neutral zone technical and moving averages indicators.
Solana is Facing Downward PressureThe market movement is generally decided by multifactor scenarios, in this case, the fundamentals for Solana look all in favor.
Solana price has declined to -6.63% in the last 7 days trading in the range of $160 to $170 and currently trading at $165.5. Ethereum’s ETF approval uplifted Solana to surge near 21.7% in the last month despite a highly volatile market.
The price action is slightly corrected, reflecting high volatility, increased selling pressure, and downward moving volume. But SOL stands strong, maintained the wave over the previous support zones, and has shown resilience towards breaking to any direction intently.
The current technical indications display a breakout is on the foothill for Solana on the direction decided by sellers.
Technicals Predict A Strong Movement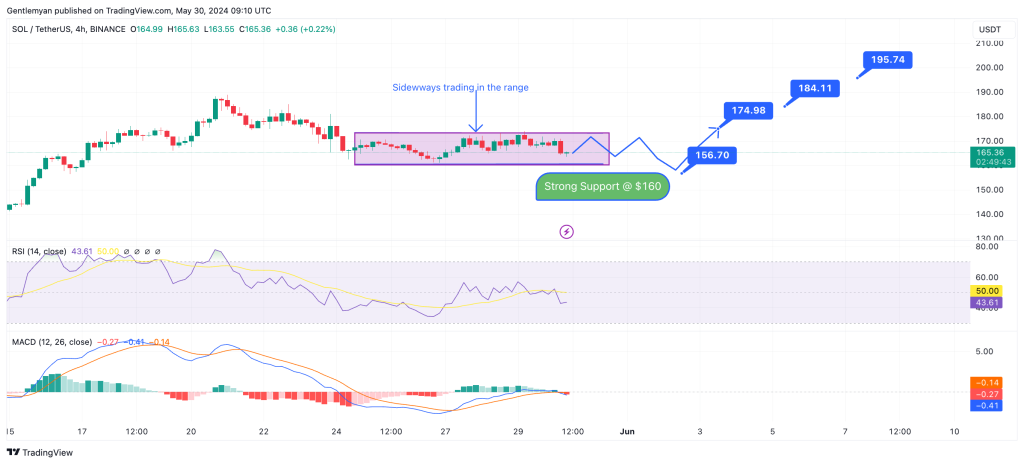
If the current price continues to break out below $160, the price will follow the lead toward the $150 zone. Conversely, the increased buying pressure will reclaim the $170 and fuel up the upward rally toward the $185 and $200.
The 4-hour SOL/USDT Chat reveals a chart pattern moving sideways with a mixed outlook. RSI reading at 50 shows price trading in a neutral zone with no overbought or oversold condition. While MACD also represents a crossover in neutral territory.
The Sideway chart pattern is usually a neutral zone for price and is best considered for traders to place positions.
The overall Solana trend is bullish, this correction phase has to be monitored cautiously. Followed by market sentiment the price seems to continue the sideway wave for a few more before retesting $160 to create a buy opportunity Dip and then pull back up the trend to $180+ in June 2024. n