XRP Price Breaks Long-Term Trend Line After 440 Days: What’s Next?
Ripple’s XRP price broke down from a long-term ascending support trend line that existed for 440 days.
Despite the breakdown, XRP trades in a short-term corrective pattern and is attempting a reversal.
Ripple Trades Below ResistanceThe XRP price had increased alongside an ascending support trend line for the past 440 days. The upward movement led to a high of $0.94 in July 2023.
The price has fallen since. After several unsuccessful bounces, XRP finally broke down from the ascending support trend line in January 2024. At the time, the trend line had existed for 440 days. The breakdown also coincided with a decrease below an important horizontal support area (red icon).
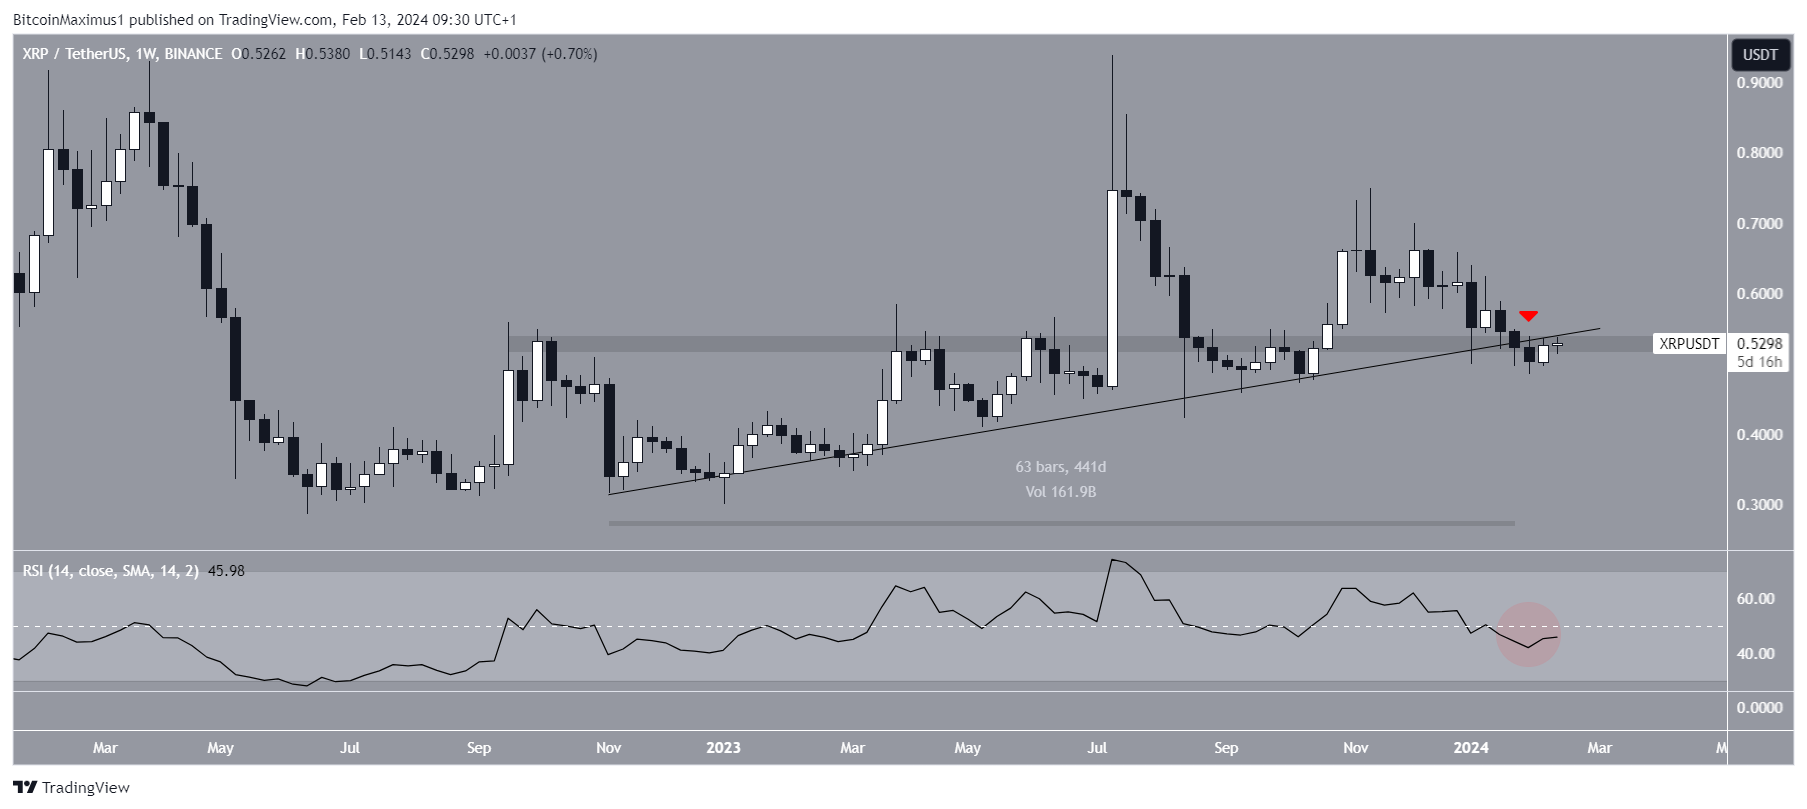 XRP/USDT Weekly Chart. Source: TradingView
The weekly Relative Strength Index (RSI) gives a bearish reading. The RSI is a momentum indicator traders use to evaluate whether a market is overbought or oversold and whether to accumulate or sell an asset.
Readings above 50 and an upward trend suggest that bulls still have an advantage, while readings below 50 indicate the opposite. The RSI trades below 50 (red circle), a sign of a bearish trend.
Read More: How To Buy XRP and Everything You Need To Know
What Are Analysts Saying?Cryptocurrency traders and analysts on X positively view the future XRP trend.
XRP_Wizardry believes the price will go to $10-$13 in this bull run, while XRP_Avengers suggests the price will go to $50.
Despite the lack of an upward movement this year, CryptoBusy noted that his holdings are in profit.
“Patiently waiting for an $XRP breakout
Between 2017 & 2020, we bought XRP at an average price of $0.11 to $0.25 and sold *some* during the last bull run. In 2022, we bought a large amount of XRP at an average price of $0.29 to $0.42. While some people may think we’re down on our XRP holdings, We’re still in profit overall and feeling optimistic.
Just end this case this year SEC and #Ripple,” CryptoBusy stated.
RealXRPWhale tweeted that there are rumors that the Securities and Exchange Commission (SEC) will settle its lawsuit with Ripple.
Read More: How to Sell Ripple
XRP Price Prediction: Can Price Save the Breakdown?The daily time frame outlook gives mixed readings. The chart shows that the price has traded inside a descending parallel channel since November. Such channels usually contain corrective movements.
The XRP price bounced at the channel’s support trend line on January 31 (green icon), beginning the upward movement.
A bullish divergence in the daily RSI preceded the increase. However, the indicator has not moved above 50 yet, something which would confirm the bullish reversal.
Notably, XRP still trades below the $0.55 horizontal resistance area. This critical level has intermittently acted as support and resistance since August 2023. The reaction to it will likely determine the future XRP trend’s direction.
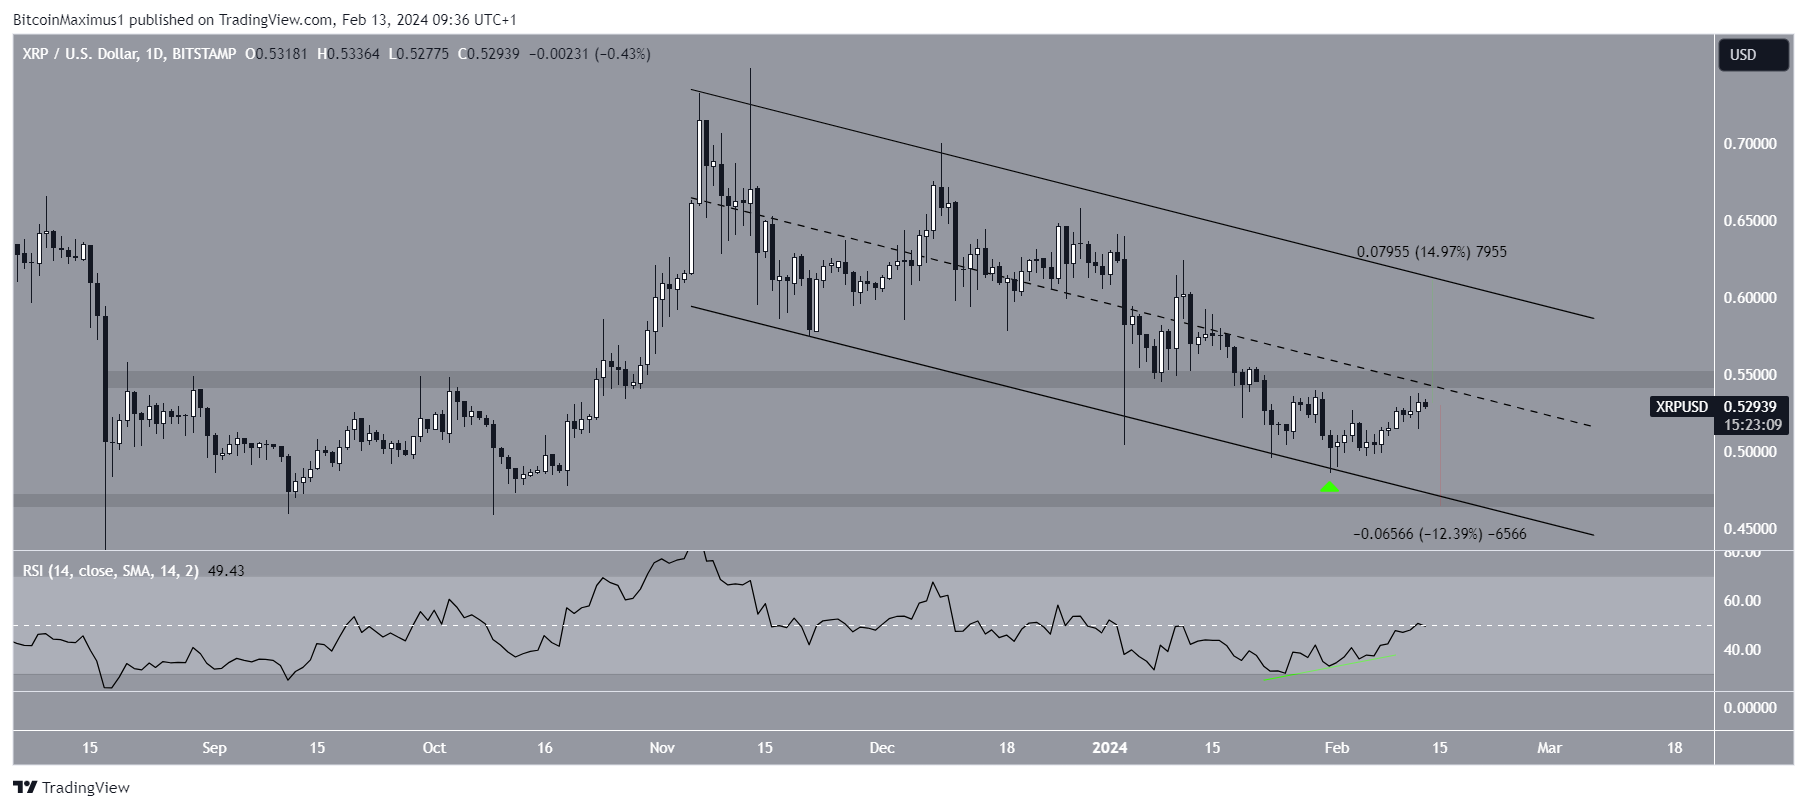 XRP/USD Daily Chart. Source: TradingView
A successful breakout could trigger a 15% increase to the channel’s resistance trend line at $0.61. Conversely, a rejection from the $0.55 area could trigger a 12% XRP downward movement to the closest support at $0.47.
For BeInCrypto‘s latest crypto market analysis, click here
Best crypto platforms in Europe | February 2024The post XRP Price Breaks Long-Term Trend Line After 440 Days: What’s Next? appeared first on BeInCrypto.