Is your PC slowing down? Here’s how to find the problem
When it comes to PCs, most users expect a reliable and lag-free experience. The boot up process takes only seconds, programs open almost without delay, and videos run smoothly. But every now and then, there’s sand in the gears: the PC crashes without warning or copying files takes minutes.
In most cases, it’s not the software but the hardware that’s responsible for the drop in performance. But where the bottleneck is located cannot be determined right away. Is a memory module defective or is the CPU overheating? Is the hard disk or SSD working at its capacity limit? Or is the application simply slow because it’s pulling data from the internet?
If your PC is slower than usual, you can find the issue by using special tools that display the current performance of the individual components. Read on to learn more.
Further reading: Is your laptop slow? Try these 9 things before you give up
Using the Task Manager tool is a good starting point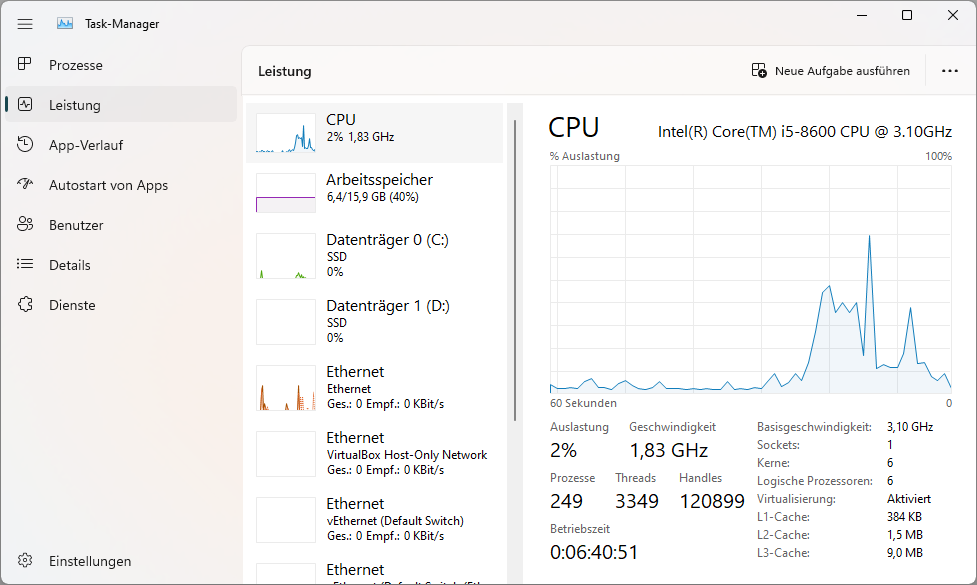
The Windows task manager displays data and statistics on the most important PC components clearly and graphically. In case of problems, this system program is your first port of call.

The Windows task manager displays data and statistics on the most important PC components clearly and graphically. In case of problems, this system program is your first port of call.
IDG

The Windows task manager displays data and statistics on the most important PC components clearly and graphically. In case of problems, this system program is your first port of call.
IDG
IDG
The Task Manager is a useful tool for performance control. Microsoft has revised and upgraded the program considerably in recent years.
To call up the task manager, press the keys Ctrl>Alt>Del and select Task Manager (you can also alternatively type task into the Windows search window). In the app, click on Settings at the bottom left and activate the option Always on top.
Now switch to the Performance tab and open the CPU, Memory, GPU, Ethernet, and/or WLAN tabs in turn. Keep the tab open and work as usual on the PC and observe the information of the components. If they are permanently above 80 percent, then there’s something wrong here.
Keeping an eye on the CPU with Core Temp and performance monitoring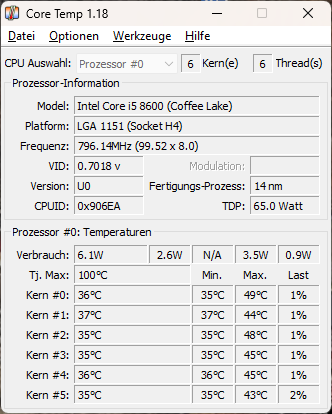
The freeware Core Temp shows the current temperatures of the individual CPU cores.
The freeware Core Temp shows the current temperatures of the individual CPU cores.
IDG
The freeware Core Temp shows the current temperatures of the individual CPU cores.
IDG
IDG
If your computer crashes again and again or runs noticeably slower, the cause is often an overheated CPU. The trigger can be a badly fitted or malfunctioning fan. The processor’s protection circuit reduces the clock frequency as soon as the temperature rises sharply. If this is not enough, the CPU is deactivated to prevent damage and the PC switches off without warning.
So you’re going to want to check the temperature of the processor with the help of Core Temp. The freeware offers a constantly updated database with all older and current CPU models from AMD and Intel and displays their data after starting. It also calls up the individual core temperatures and displays them on the tool interface and at the bottom of the taskbar.
The program window shows the maximum permissible CPU operating temperature at Tj. Max and the current temperatures below it. If these are permanently above 80 degrees, there’s probably a cooling error. Now you’ll want to look inside the computer to see if the fan is spinning and is firmly seated on the processor.
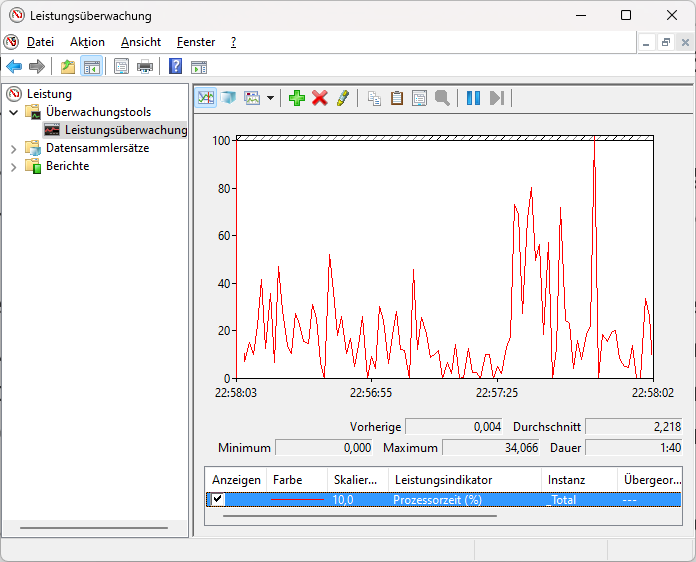
Windows performance monitoring tracks the percentage of processor time required for a thread in the graph (shown below).
Windows performance monitoring tracks the percentage of processor time required for a thread in the graph (shown below).
IDG
Windows performance monitoring tracks the percentage of processor time required for a thread in the graph (shown below).
IDG
IDG
If the PC is simply doing its tasks too slowly, this may also be due to the CPU. In this case, observe the utilization curve in the task manager. Another helpful tool is Windows’ performance monitoring, which you can call up by entering perfmon in the search field. After starting it, open Performance > Monitoring tools > Performance monitoring in the left column.
Now a constantly updated diagram appears showing the processor time at the bottom. This value indicates how much time the CPU needs to execute a thread. Thread here means certain program actions, i.e. in word processing for text input, for saving, for printing, and so on. The less processor time the CPU has to spend to execute a thread, the better. If the value in the performance monitoring is permanently above 80 to 90 percent, the CPU is too slow and should be replaced.
Test your RAM for defects and errorsRecurring PC crashes can be caused not only by the CPU, but also by the memory components of the main memory. Defects due to production errors or overheating are by no means rare. If individual memory addresses can no longer be addressed, Windows crashes.
With Memtest you can check the built-in RAM for errors. However, the software requires some preliminary considerations. Since Windows does not allow access to memory that is already in use elsewhere, Memtest can only ever check the free RAM. Therefore it’s best to reboot the computer, not call up any other program afterwards, and just start Memtest. Since Windows moves its subsystems dynamically in the memory, the tool will sooner or later examine the entire RAM.
Memtest can examine a maximum of between two and 3.5 GBytes of contiguous memory. Therefore, look in the Task Manager under Performance>Memory to see how much memory is currently available and divide the Mbyte value by 2,000. The result is the number of Memtest instances you should open in parallel. In each of them, enter 2,000 megabytes as the memory volume. Let each instance run until a coverage of 100 percent is reached. According to the manufacturer, this will detect 95 percent of all memory errors. If Memtest encounters an error, the program stops and issues a message. In this case, it’s best to replace the memory latch.
Check the temperature and functionality of your graphics cardThe graphics card can also cause crashes, especially if it is being used to capacity by a PC game. In this case, the GPU can overheat and memory errors can occur.
You can read the temperature in the task manager under Performance>GPU. Better suited than the on-board tool, however, is GPU-Z. This tool collects and displays additional information about the hardware. As a rule of thumb, the GPU should not get hotter than about 80 degrees. Otherwise, there’s a risk of hardware defects. If GPU-Z detects higher values, check whether the card fan is running and firmly seated. Whether it can be replaced depends on the graphics card itself.
OCCT can be used for a memory test of the graphics card. On the user interface, click on Test>VRAM on the left. Select the correct graphics card and the test duration. The default setting is 30 minutes, which is sufficient even for generously equipped cards. Now click on the start symbol at the bottom. If the program diagnoses a memory error, you have no choice but to install a new graphics card.
If a game only runs slowly and jerky with a low frame rate, the GPU might simply be overtaxed. This can be tested with the 3DMark benchmark, but the free demo version is very limited.
Getting to the bottom of long waiting times during copying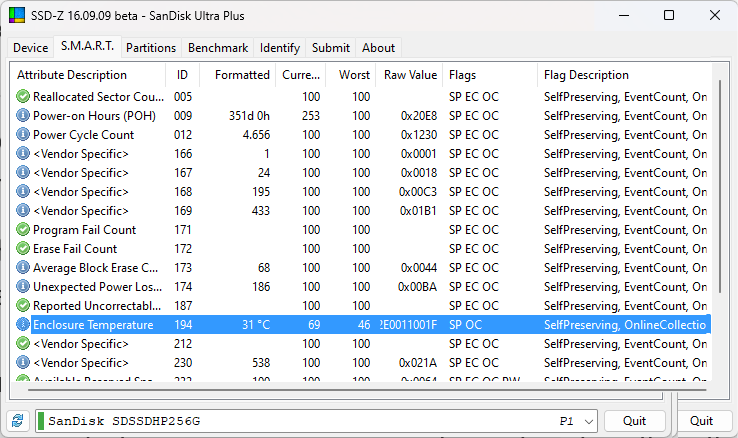
The tool SSD-Z reads the S.M.A.R.T. data of your SSD or hard disk and points out errors when reading or writing.
The tool SSD-Z reads the S.M.A.R.T. data of your SSD or hard disk and points out errors when reading or writing.
IDG
The tool SSD-Z reads the S.M.A.R.T. data of your SSD or hard disk and points out errors when reading or writing.
IDG
IDG
If booting Windows suddenly takes a disproportionately long time despite the SSD, you should check the data medium. Crystaldiskmark has proven itself as a speed test. The tool performs several test runs and measures the time for writing and reading data. If the values are conspicuously low, we recommend taking a closer look. Crystaldiskmark not only detects hard disks and SSDs, but can also measure USB drives and sticks.
SSD-Z is suitable for more in-depth analyses. This tool displays the technical data and the current temperature of the storage medium and also lists the S.M.A.R.T. values of the drive. SSD-Z also comes with its own benchmark, but it is less precise than that of Crystaldiskmark.