Over $60 Million in Chainlink (LINK) Moved Off Exchanges: What It Means for Price
More than six million Chainlink (LINK) tokens have been pulled from exchanges in the last seven days. This large outflow indicates growing confidence among LINK investors, as many are choosing to keep their assets in private wallets instead of centralized exchanges.
With LINK’s price already showing signs of resilience, this trend might set the stage for further upward momentum, making it a key cryptocurrency to watch in the coming days.
Chainlink Tokens See Massive ExodusAccording to Glassnode, Chainlink saw a brief surge in tokens sent to exchanges between September 5 and 9, coinciding with a price drop from nearly $11 to $9.20.
However, since September 10, over six million tokens worth more than $60 million have been withdrawn from exchanges. This kind of movement typically indicates bullish sentiment, as reduced selling pressure on exchanges can support price appreciation.
At press time, Chainlink is trading at $10.60. If the trend continues, the cryptocurrency could retest the $12 level and potentially break above it.
Read more: Top 11 DeFi Protocols To Keep an Eye on in 2024
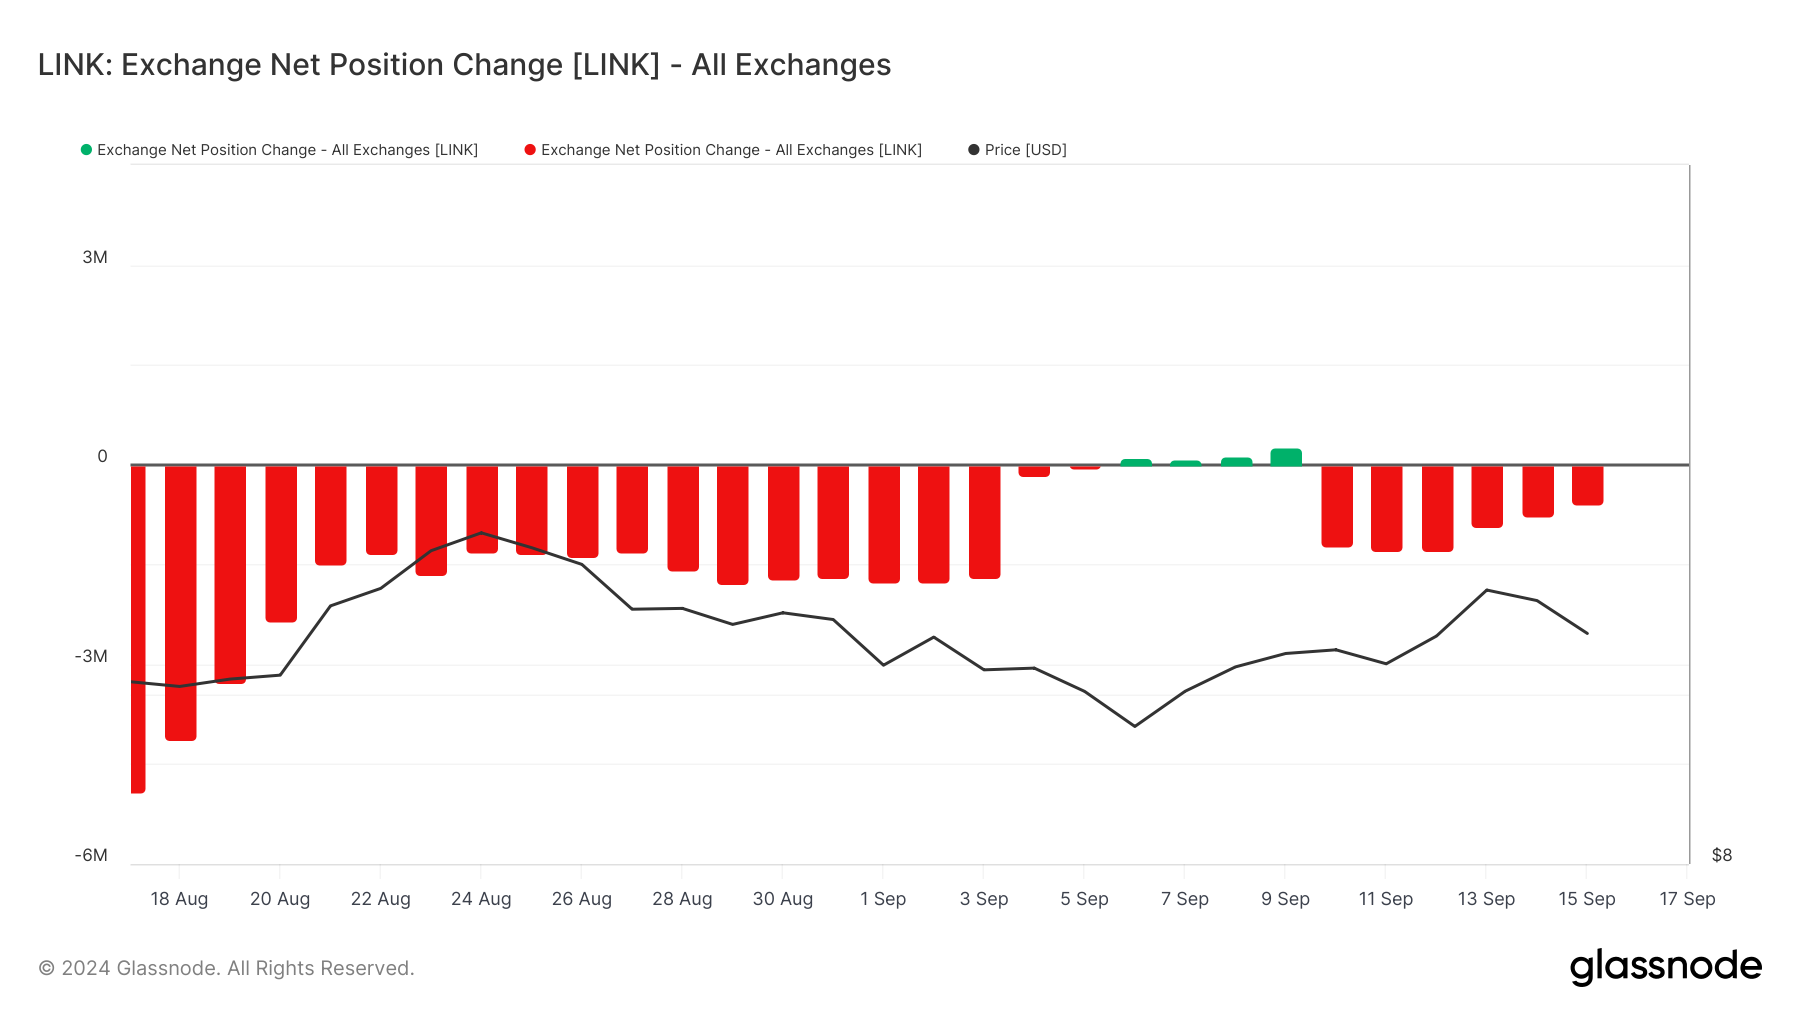 Chainlink Exchange Net Position Change. Source: Glassnode
Furthermore, the Bulls and Bears indicator reinforces the bullish outlook. This metric tracks the number of addresses that bought or sold at least 1% of the total trading volume in a given day.
Crypto bulls are addresses that purchased at least 1% of the volume, while bears sold a similar amount. According to IntoTheBlock’s data, Chainlink bulls have bought more volume than the bears have sold.
With this higher level of accumulation, it’s less likely that Chainlink will drop to single-digit values again, as it did recently.
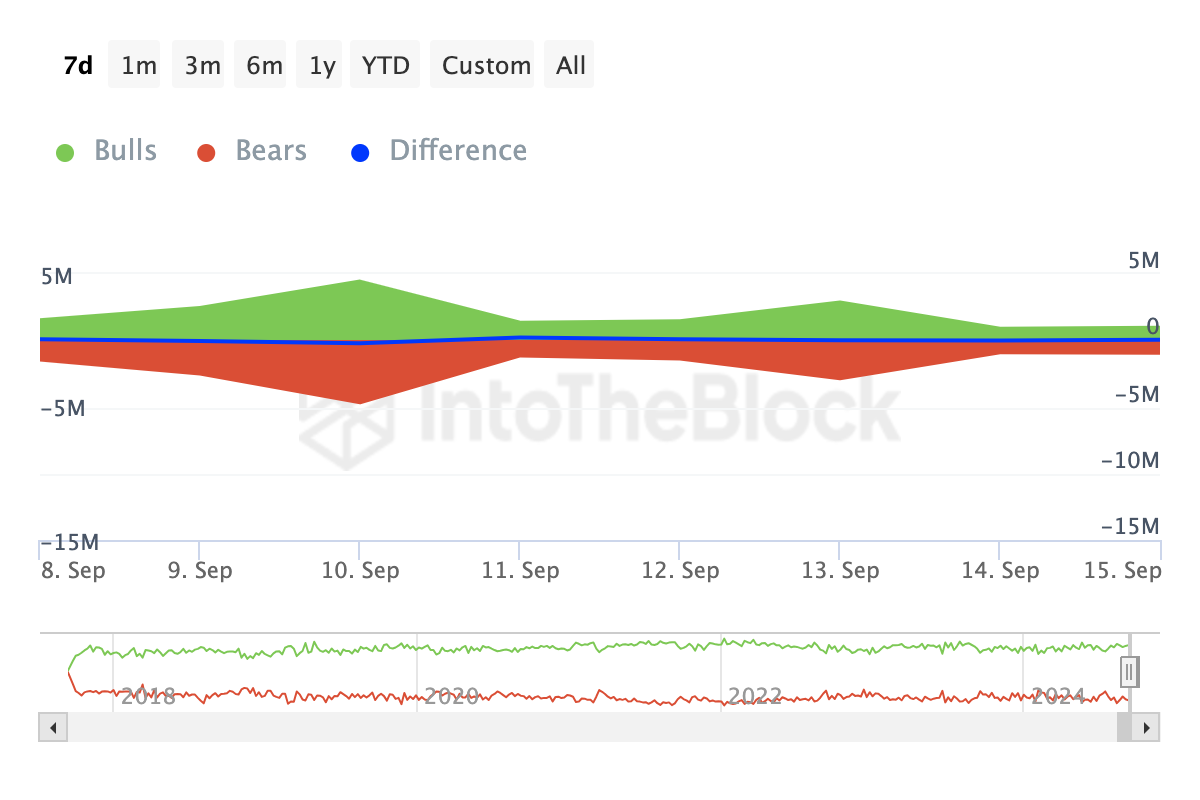 Chainlink Bulls and Bears Indicator. Source: IntoTheBlock
LINK Price Prediction: Boost on the Horizon
Chainlink Bulls and Bears Indicator. Source: IntoTheBlock
LINK Price Prediction: Boost on the Horizon
On the daily chart, the Parabolic Stop-and-Reverse (SAR) indicator flashed a bullish signal. The SAR determines an asset’s price direction and also indicates the period during which a trend is changing.
Typically, when the dotted lines of the indicator are above the price, the trend is bearish. For instance, that happened around August 25 when the price was $12.34. By September 6, LINK’s price decreased to $9.56.
Currently, the Parabolic SAR is below Chainlink’s price. As a result, the token might see a 26% price increase to $13.38.
Read more: 12 Best Altcoin Exchanges for Crypto Trading in September 2024
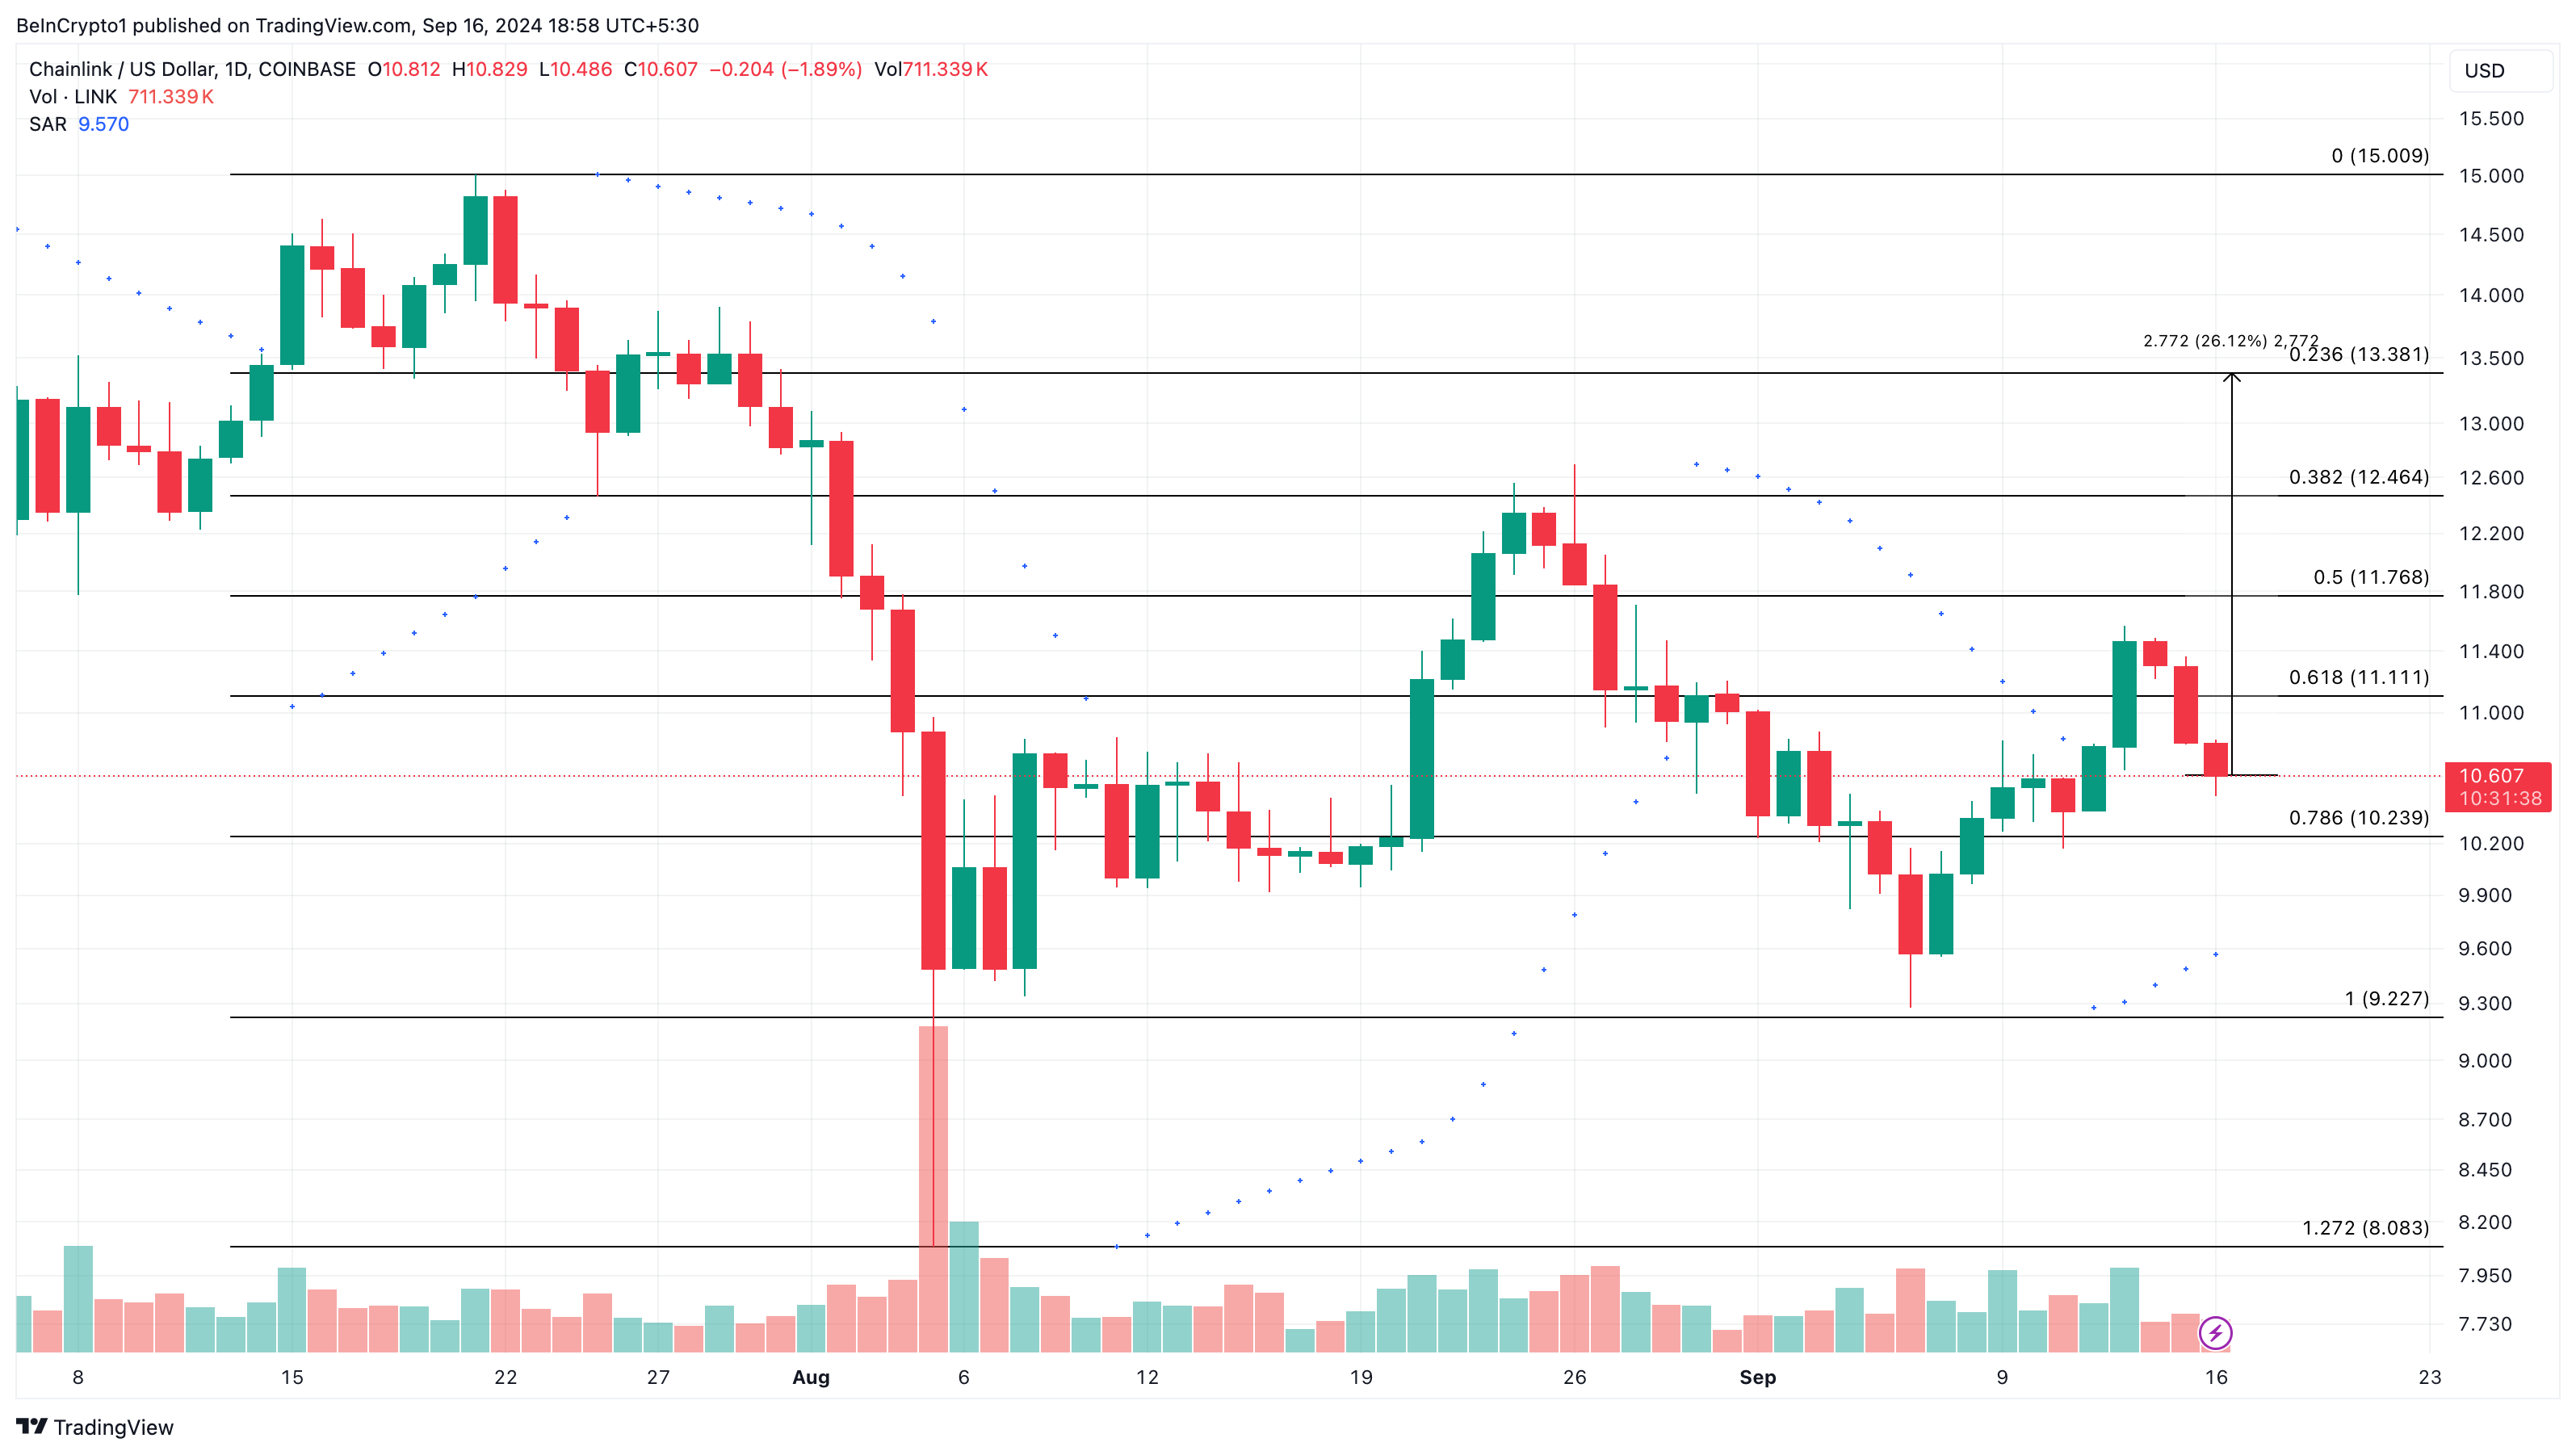 Chainlink Daily Analysis. Source: TradingView
However, if LINK fails to break the resistance at $11.11, its price could decline to $9.22. Traders should keep a close eye on this key level, as it could determine whether the cryptocurrency experiences a potential upswing or a further drop.
The post Over $60 Million in Chainlink (LINK) Moved Off Exchanges: What It Means for Price appeared first on BeInCrypto.